
Website analytics is a crucial part of search engine optimization.
The saying What gets measured gets improved is 100% correct in SEO. Using the right tools to track and analyze your website’s performance will help you answer important SEO questions, such as:
- What keywords you rank for in Google
- What is the click-through rate of your pages in search results
- What country your visitors come from
- What channels bring you the most traffic
- How your visitors engage with your pages
- What are your most visited pages
To help you understand the basics, we’ll cover 3 important analytics tools every website owner should have: Google Search Console, Google Analytics and a rank tracking tool.
Google Search Console
Search Console is a free online tool (or a series of tools) by Google that helps webmasters see how their site is performing in Google Search and optimize the visibility of their websites.
Google Search Console is an essential tool that is hard to be replaced. Every website owner should use it.
Note: To set up the Google Search Console, you need to verify the ownership of the website first. You’ll find a detailed step-by-step walkthrough on how to do it in our simple guide to Google Search Console.
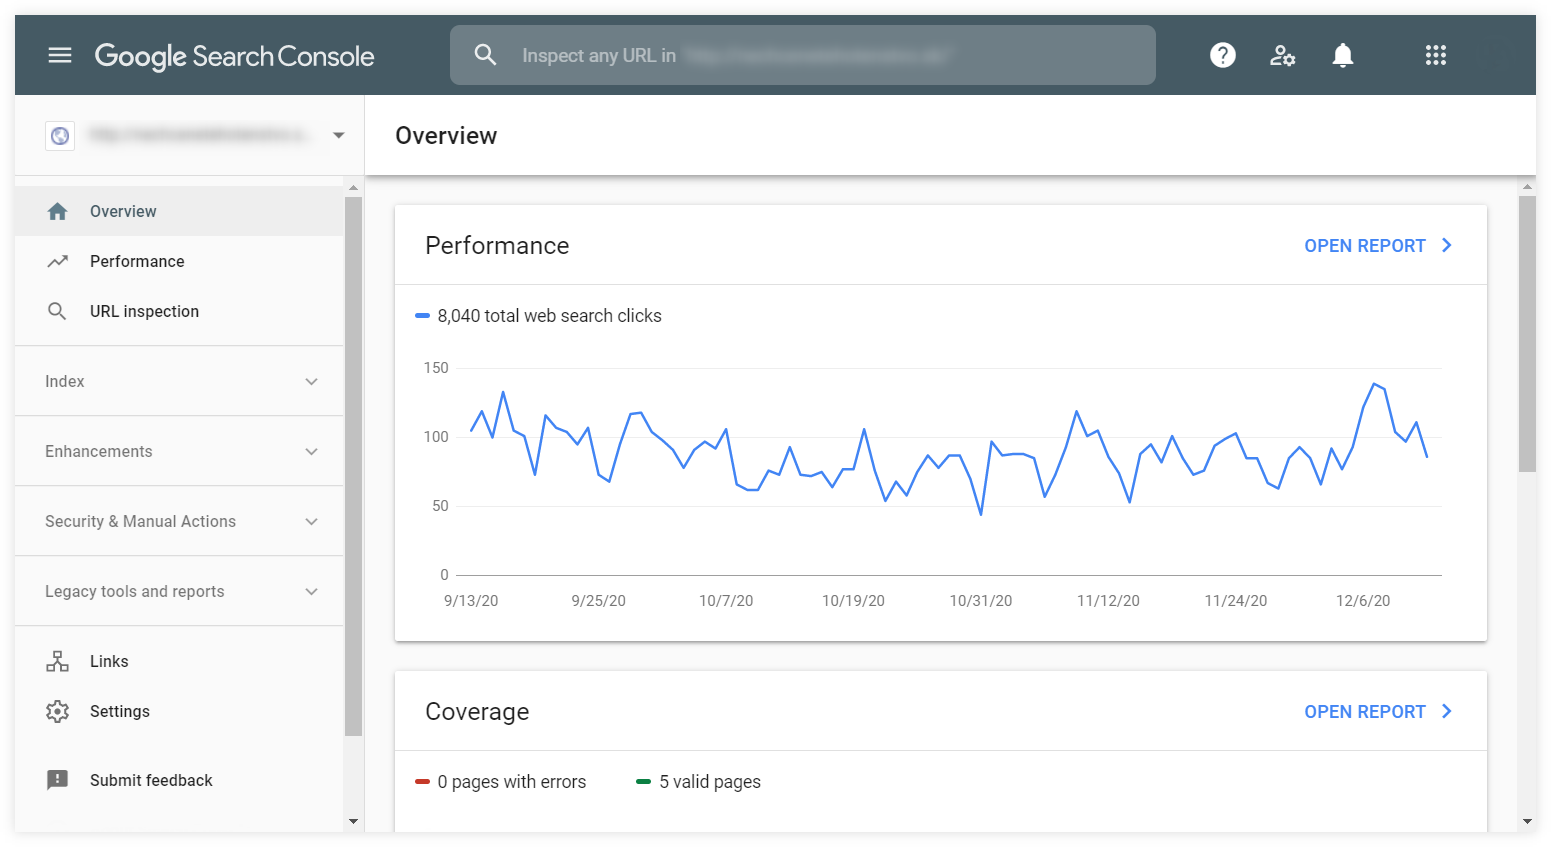
Search Console consists of several dashboards from a basic overview of your website’s performance to reports of critical issues that you should address.
- Performance – gives you insights into how your site performs in Google Search results
- URL inspection – gives you information about Google’s indexed version of any of your pages
- Coverage – shows what pages are indexed on Google and reports any issues with indexation
- Sitemaps – enables you to add a new sitemap and see your previous submissions or problems
- Removals – serves as a tool to temporarily block any page from search results
- Enhancements – provides information about your enhancements (such as AMP, sitelinks, etc.) and user experience and usability issues
- Manual actions – shows whether you have any manual penalty from Google
- Security issues – reports any detected security issues on your site
- Links – provides a basic overview of your links (both external and internal)
The report you’ll spend the most time with and the one we’ll take a closer look in this chapter is the Performance report.
Performance report
The Performance report will give you a detailed overview of your site’s performance in Google Search.
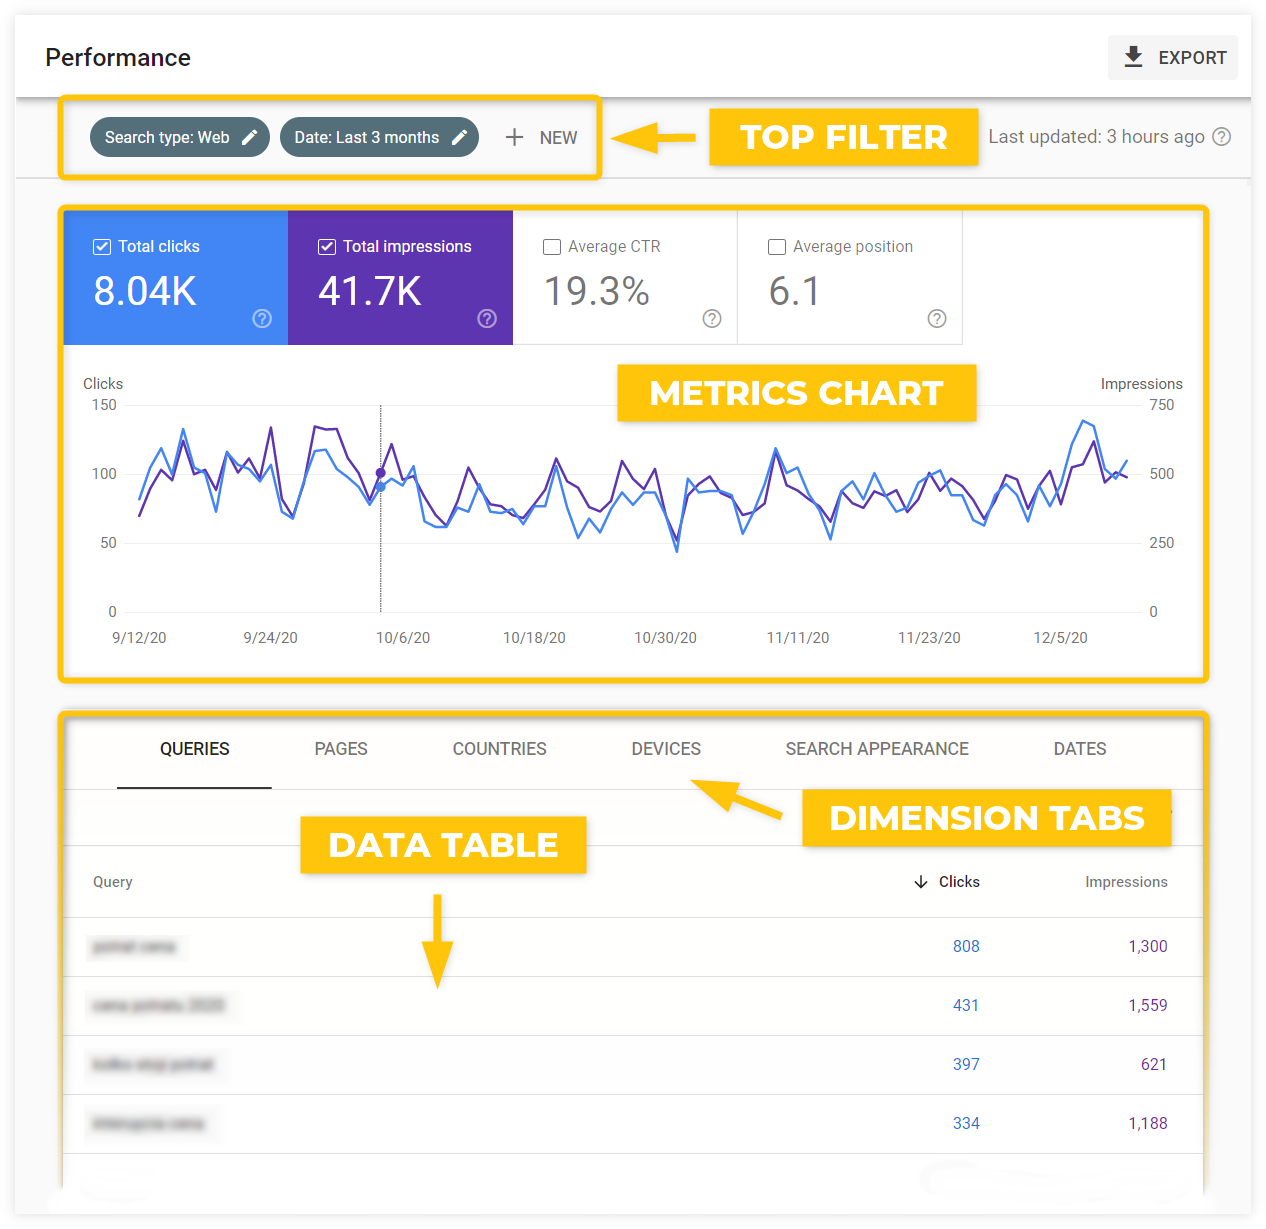
It consists of 3 main areas you can configure to see the data you need:
- Top filter – allows you to select the search type, date range and filter the dimensions
- Metrics chart – shows the chart with the 4 main metrics (clicks, impressions, average CTR and average position); you can select any combination of the metrics by clicking on them
- Dimension tabs with data table – allows you to select the preferred dimension and see the data in a simple table
To get a quick overview of how the Performance report works, you can watch this short educational video by Google Search Central:
Besides the basic (but very useful) data like top queries or top pages, the Performance report is a goldmine of various deeper insights into your site’s search performance.
Let’s take a look at a few specific use cases:
Troubleshoot the performance drops
When analyzing any change in your performance (e.g. sudden drop in clicks), always try to find the root of the problem by checking various dimensions to find what exactly caused the changes.
Sometimes the overall performance can be influenced dramatically by a change in a specific country, a ranking drop of s single big keyword or a performance issue on a specific type of device.
Tip: Create a comparison of two subsequent time frames (Top filter – Date – Compare) to see the biggest changes when put in contrast with the previous time period.
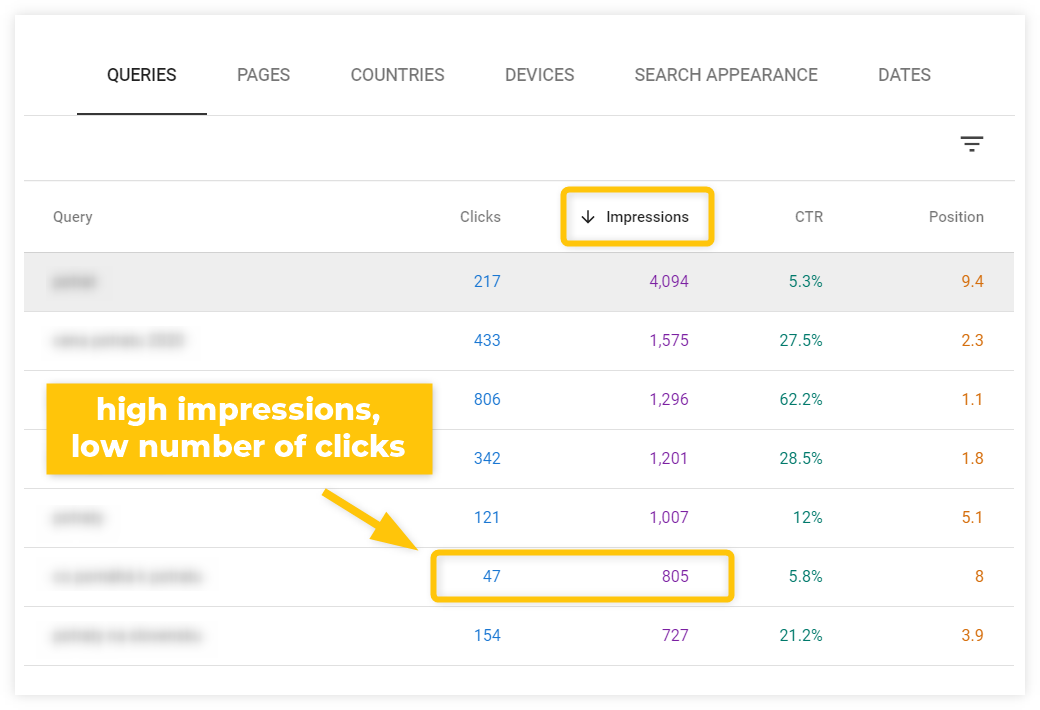
Find pages that need the CTR optimization
Look at the top-performing queries that have a low click-through rate (either using the Average CTR metric or comparing the Impressions and Clicks).
There’s a high chance you can improve the CTR by writing a better title tag and meta description for the page that ranks for the query.
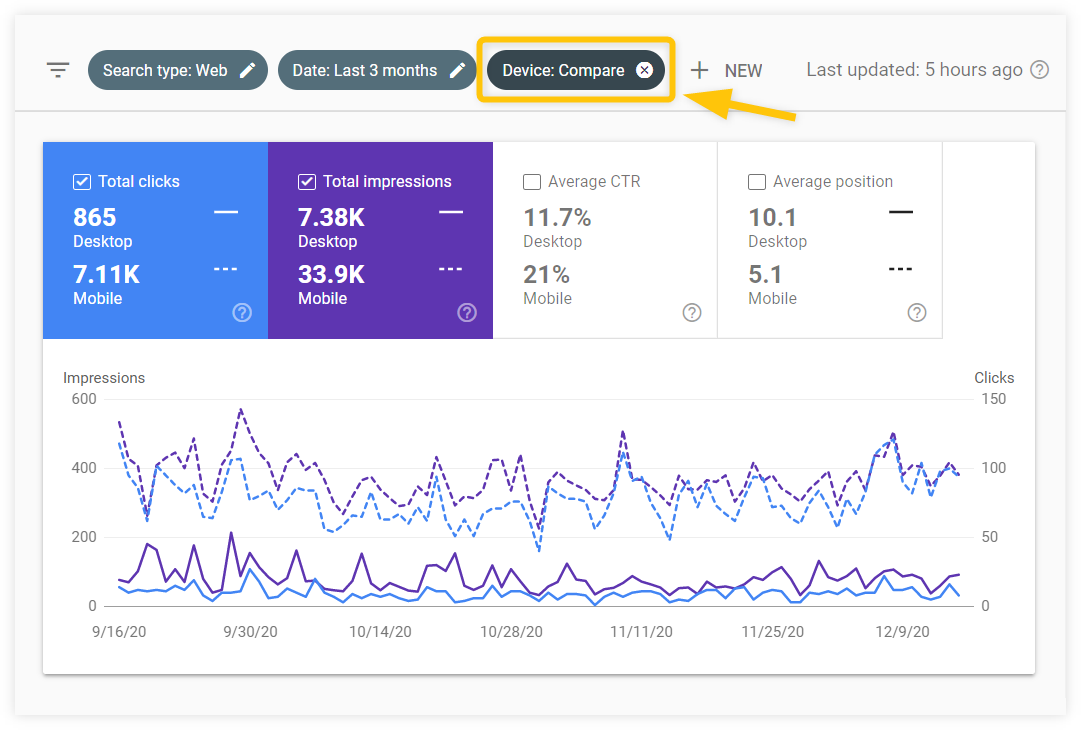
Compare your performance on desktop and mobile devices
In the top filter, select the device dimension and choose Compare instead of Filter.
You’ll be able to see the comparison of your performance on desktop and mobile devices and take appropriate steps when it comes to further optimization of your site.
Find low-hanging keywords you can rank for easily
In the dimensions table, use the filter to only show queries you rank for on position 20 or less (which means the keyword you rank for on 3rd SERP or higher).
Once you find such a keyword, switch to the Pages tab to see the page that ranks for it. These are pages that may need just a little optimization to rank better.
See whether you can improve the page that targets the keyword, or create a new piece of content that would focus on the keyword.
Compare branded and non-branded searches
You can use the top filter to only show queries that include (“queries containing”) your brand name.
You’ll see how much of your search traffic comes from branded keywords and how these keywords perform in Google Search.
Google Analytics
Google Analytics is a free website analytics tool that tracks and reports website traffic and user behavior. It is a powerful tool that offers a ton of useful data.
The problem is that many beginners feel lost and overwhelmed when opening their GA account.
It’s completely normal. There are too many reports, too many metrics, too many different graphs and complicated navigation.
Note: Setting up Google Analytics is not complicated. You just have to insert a special piece of code on your website. Read this detailed guide on how to do it.
So, how do you learn using Google Analytics?
One step at a time.
What kind of data can you find in GA?
Google Analytics consists of various reports.
The home dashboard will show you a quick overview of the basic performance metrics. To see more, you can navigate to the detailed reports.
The reports are divided into 5 main categories based on what kind of data they provide. You can find them in the left menu.
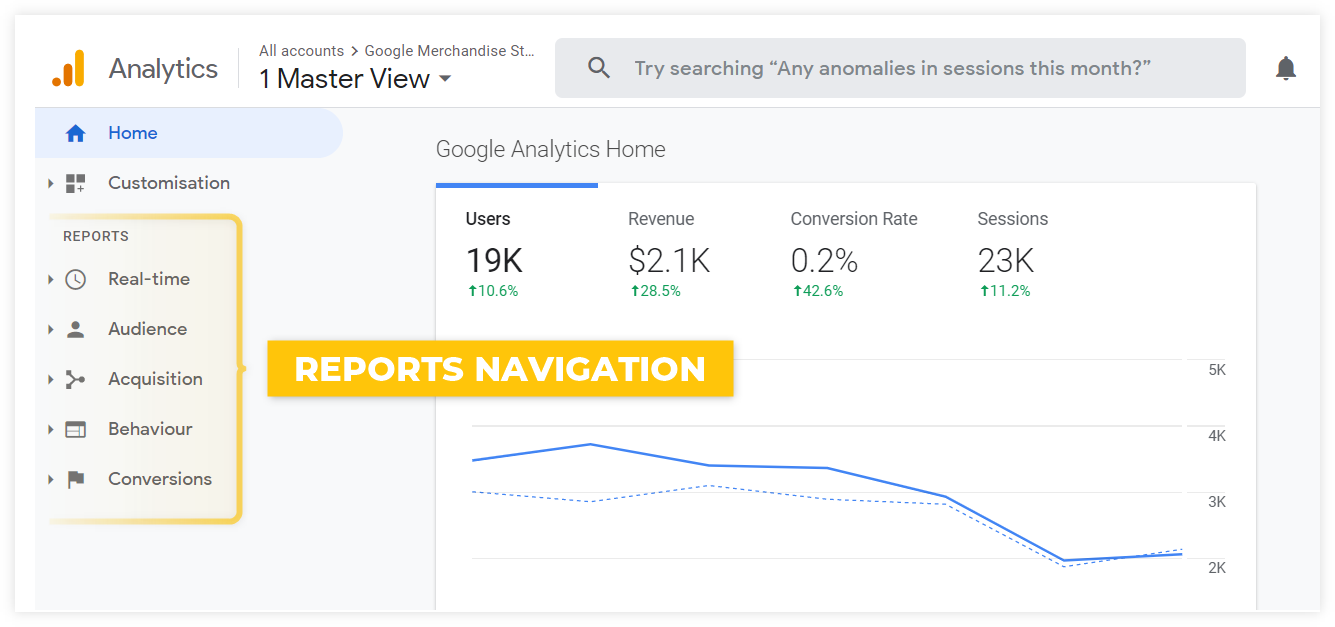
- Real-time – the users’ activity as it happens in real time
- Audience – everything you need to know about your visitors (demographics, interests, technology used, etc.)
- Acquisition – where your traffic comes from (traffic channels, top referring pages, etc.)
- Behavior – what the visitors do on your website (what pages they visit and how they engage with them)
- Conversions – details on how your visitors convert (in accordance with your goals; e.g. purchase, subscription, affiliate link click, etc.)
Data segmentation
In each report, you can further segment the data to see detailed results based on your specific needs.
Segmentation and filtering are crucial in selecting the right data for your analysis.
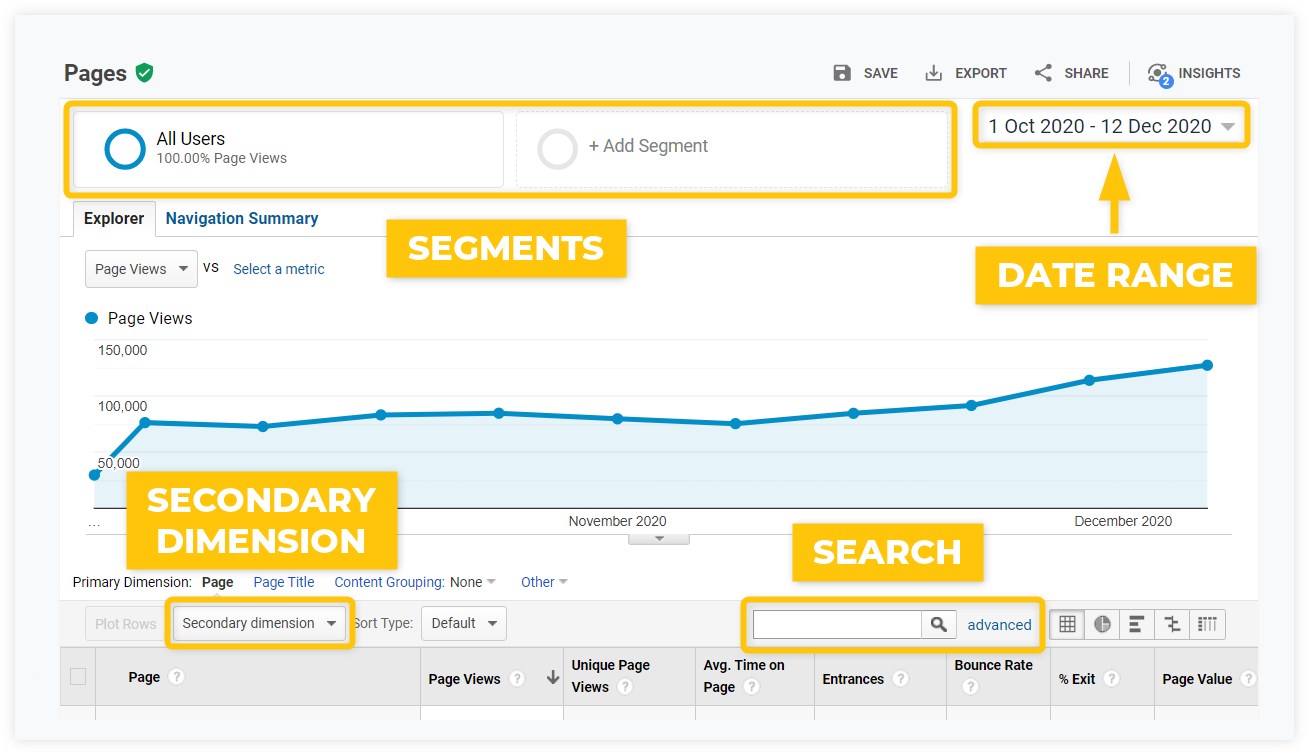
Date range
Selecting the right time frame is the first thing you should do when working with any analytics tool.
You can find the date range selector at the top right of every report. It enables you to look at the data within various time frames or compare two time periods.
Segments
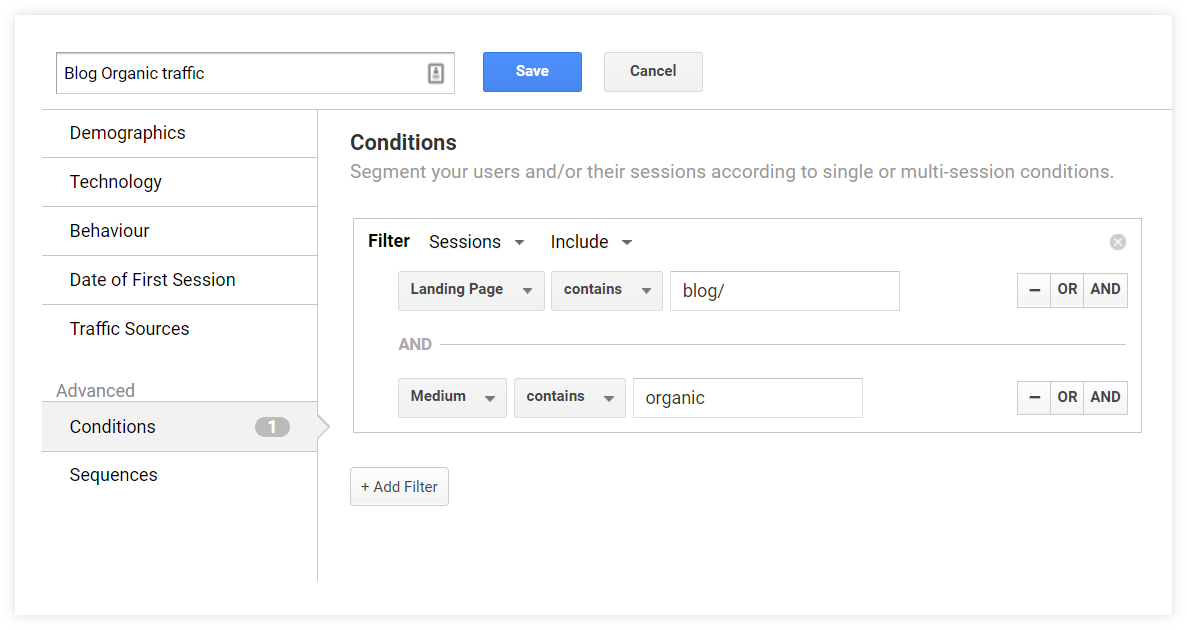
Segment is any subset of data in Google Analytics. You can select one of the default segments (e.g. Organic Traffic, Mobile Traffic) or create and save a new one to speed up your workflow.
For example: You can create a specific segment that will show only your organic blog traffic so that you can analyze the organic reach of your articles separately from other pages.
Here’s what the setting would look like:
Secondary dimension
The secondary dimension is an additional dimension you can add to the primary dimension of the given report.
For example: In the All Pages report showing the top pages, you can add the User Type secondary dimension to see the proportion of new vs. returning visitors for each page.
Search
There’s a simple search option above every data table to narrow down the results.
The most useful reports
To describe all the features and data reports Google Analytics has to offer, we would need a separate ultimate guide.
But the truth is, the vast majority of beginner users will do just fine with sticking to a couple of basic reports.
Here are the most useful ones:
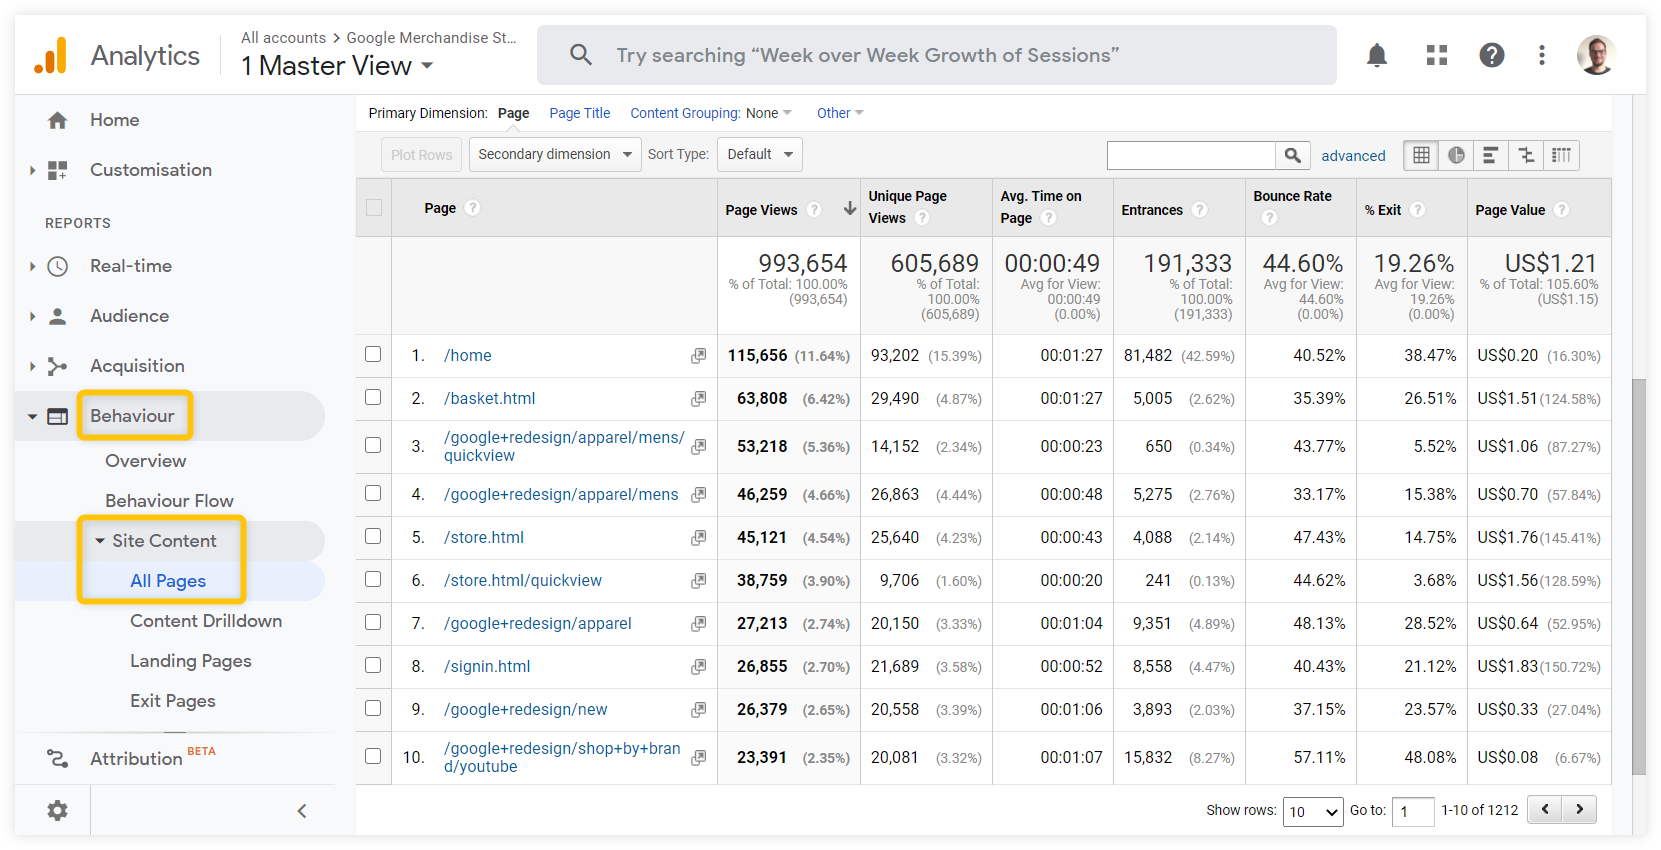
1. See the most visited pages on your website
Behavior – Site Content – All Pages
The All Pages report is the most basic report and one of the main reasons most people use Google Analytics – to see how much traffic their pages get.
It’s helpful in determining what people are interested in when they visit your website and make decisions on what pages need improvement.
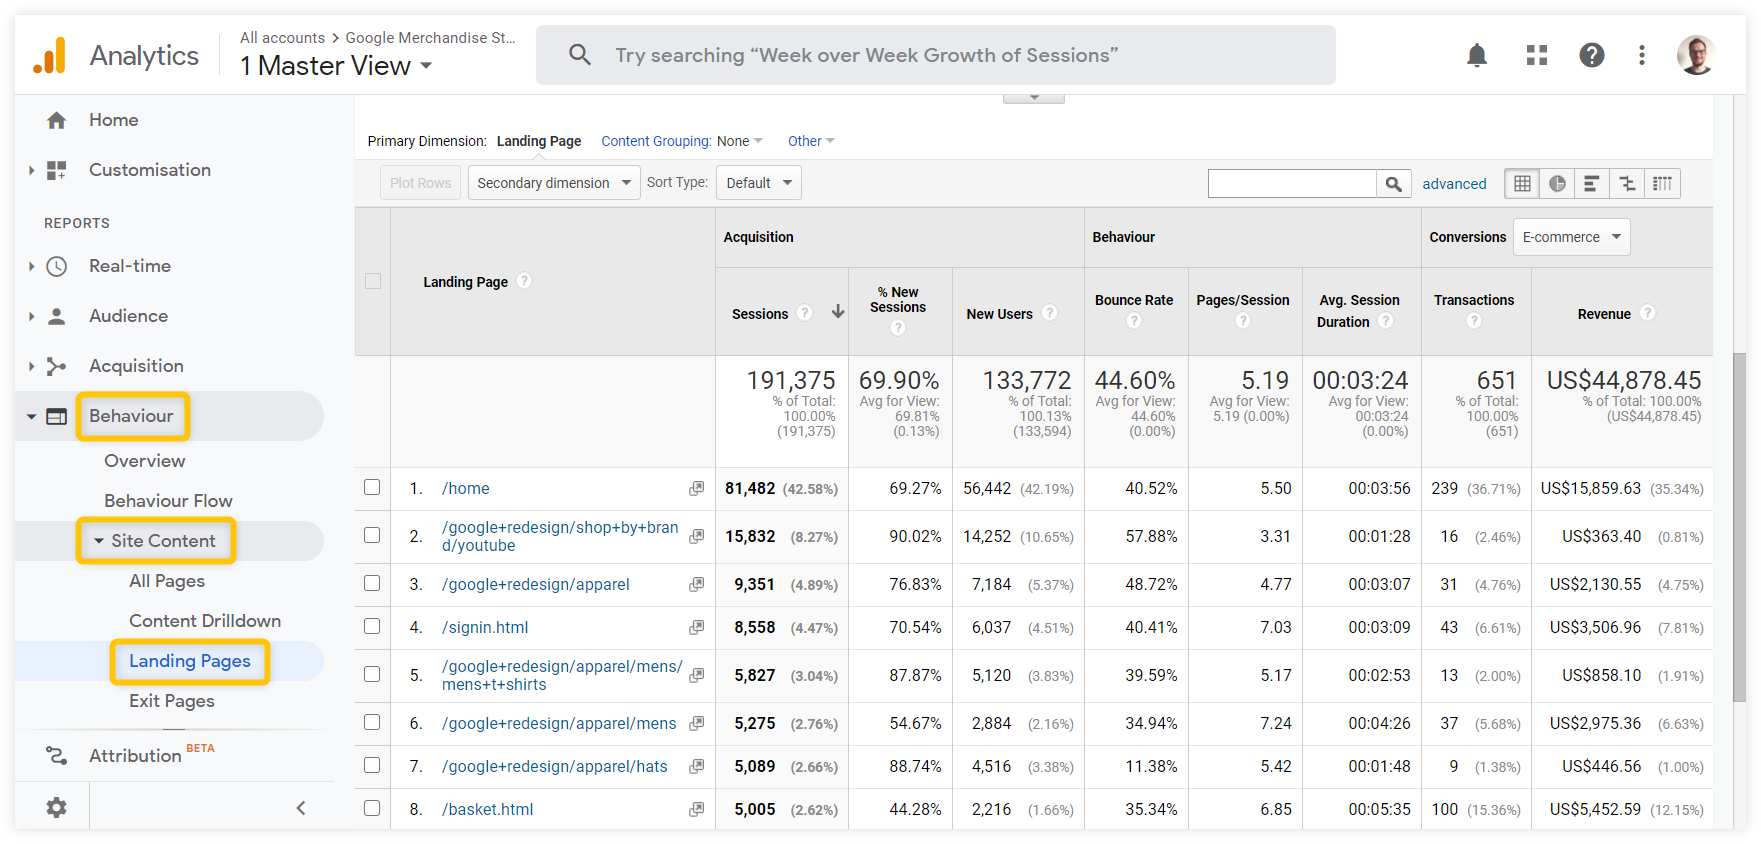
2. See the first pages people visit on your site
Behavior – Site Content – Landing Pages
The Landing Pages report is very similar to the All Pages report, but it only shows the top pages people used to enter your website.
It is also a great report to use when analyzing the organic traffic from Google (the pages people visit from the Search are always landing pages).
3. Find the best sources of your traffic
Acquisition – All Traffic
Besides seeing the performance of your pages, it is also very important to know where your traffic comes from.
The All Traffic report includes various sections:
- Channels – see the percentage of your traffic by the most common traffic channels (organic, referral, direct, social, etc.)
- Source/medium – see the origin of your traffic and the source category (e.g. google/organic, bing/organic)
- Referrals – see the top pages that refer traffic to your site
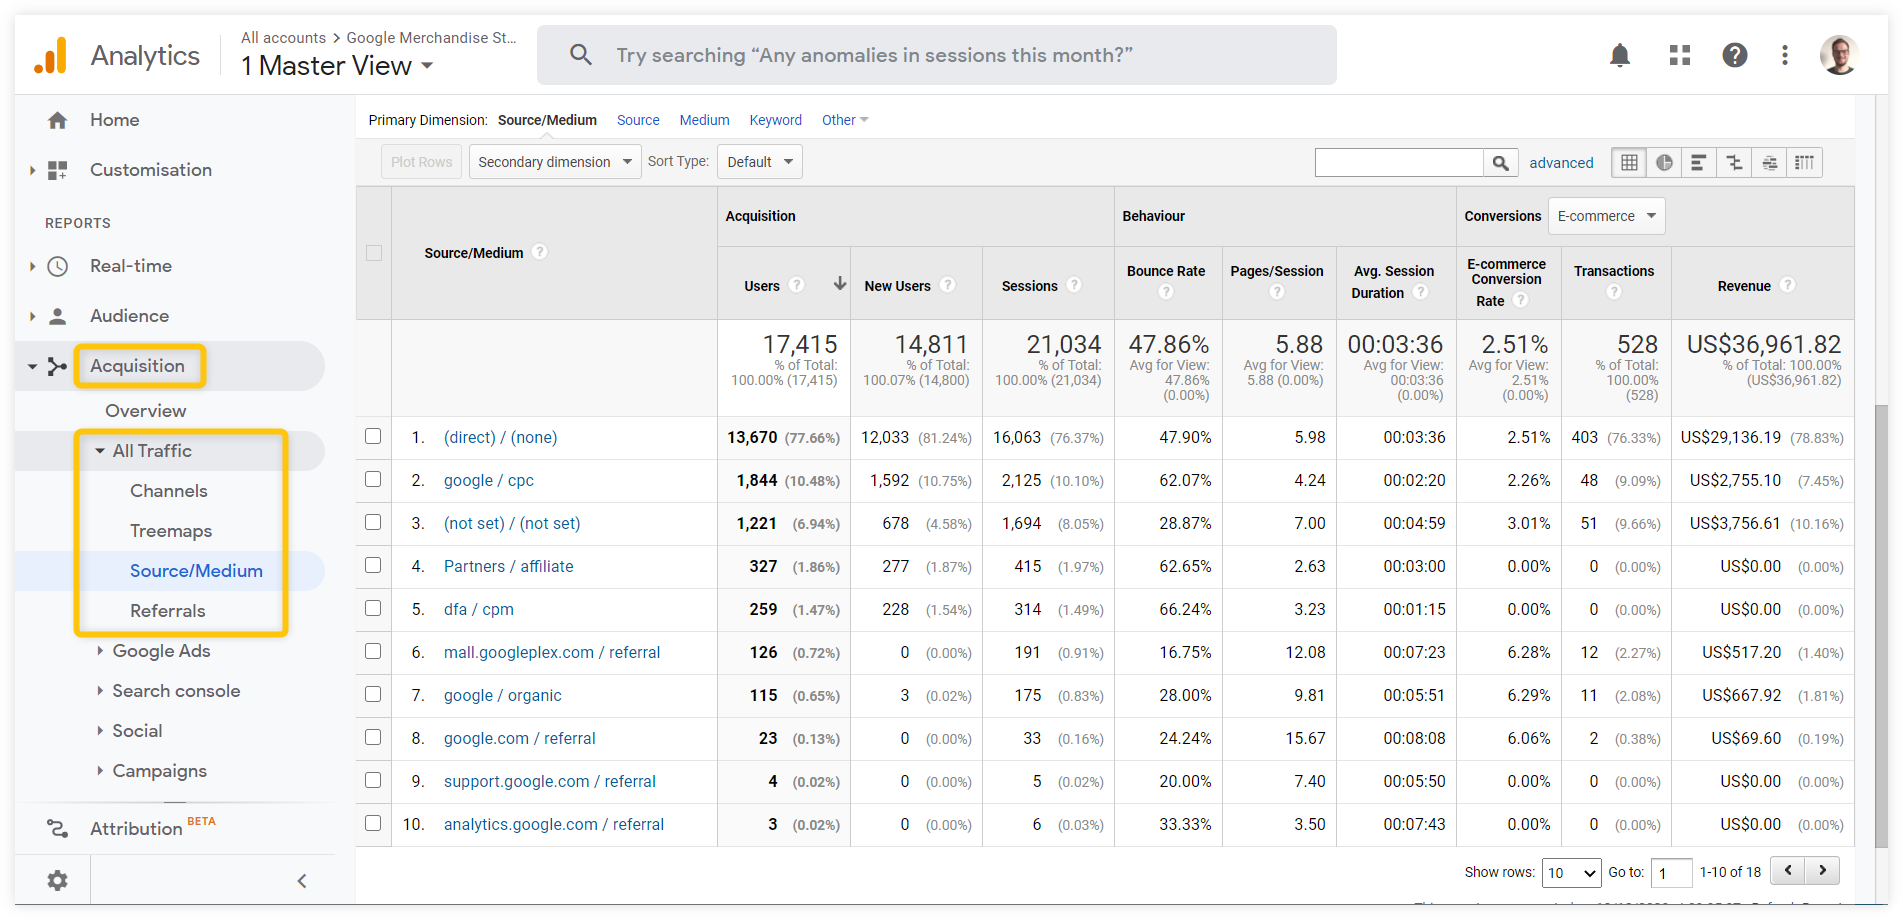
For example, let’s say you noticed a spike in your traffic.
You can go to the Source/medium report, compare two time periods to see a source/medium combination that has the biggest increase in users when compared to the previous time period.
Once you find it, you can add various secondary dimensions to find further information (e.g. the Landing Page secondary dimension to see pages through which the users entered your website or Country/City secondary dimension depending on your target market).
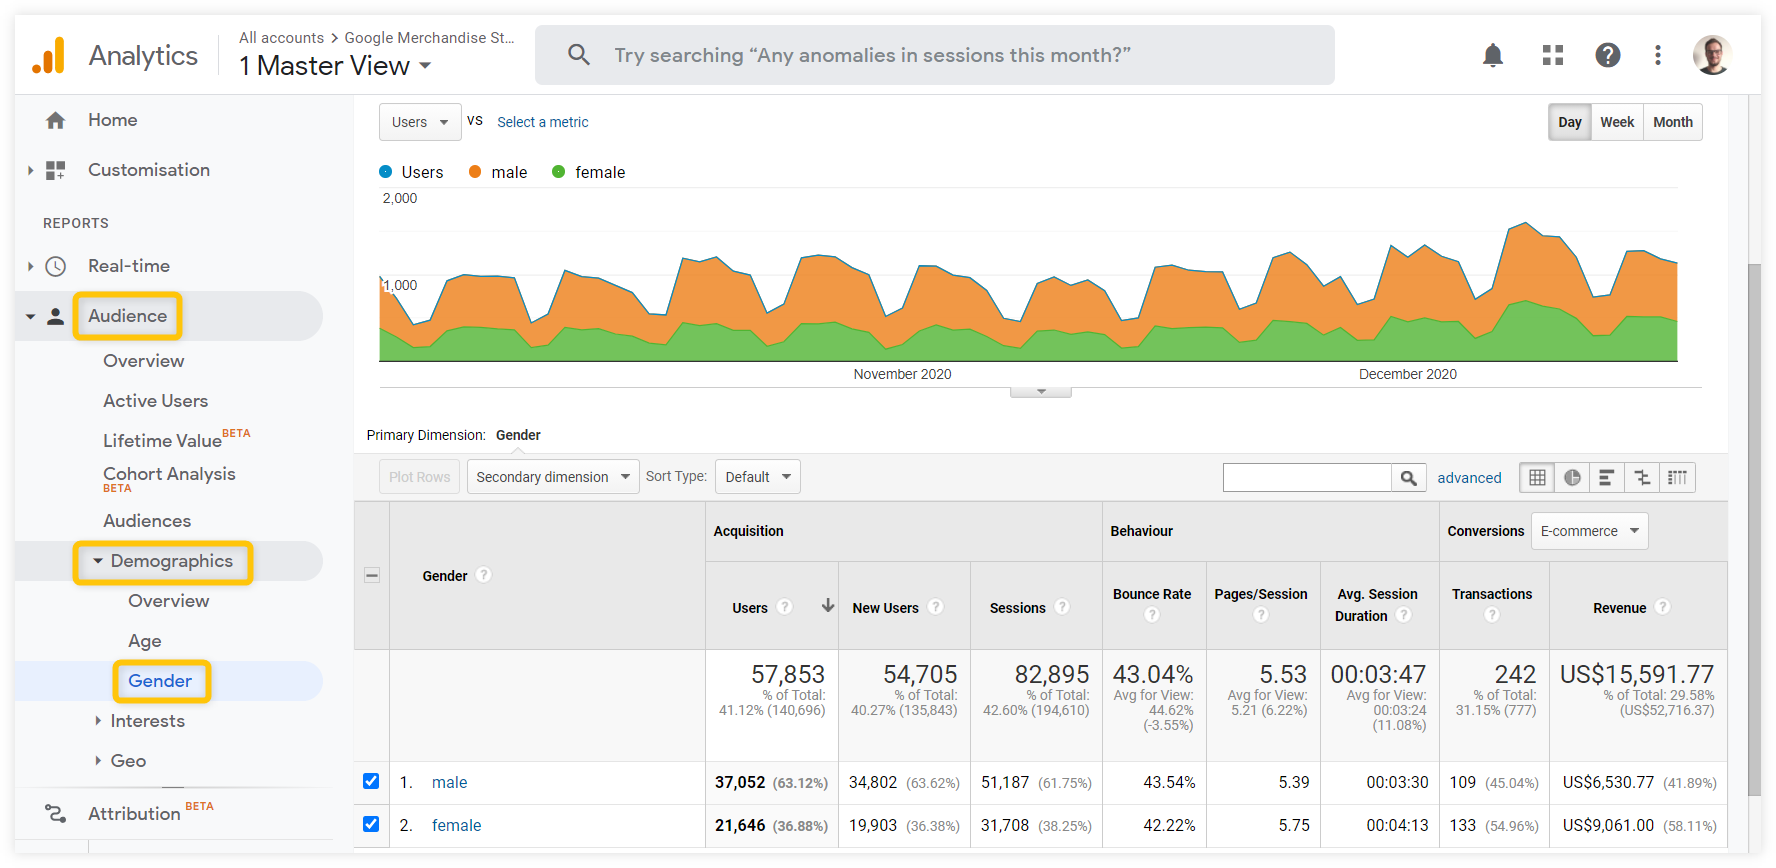
4. Get to know your visitors
Audience – Demographics; Audience – Geo – Location
Last but not least, Google Analytics can give you insights about your audience. The most useful ones are Demographics (age, gender) and Location (countries).
Here’s what the audience demographics Gender report look like:
The most useful metrics
Google Analytics comes with various metrics that measure three things:
- How much traffic you get (acquisition metrics)
- How people engage on your site (behavior metrics)
- Achievement of your goals (conversion metrics)
Traffic acquisition metrics
The most common traffic acquisition metric often get confused so here’s a quick explanation of the differences between them:
- Users – a user is an individual visitor to your website, more visits by the same user don’t increase the number of users
- Sessions – session a period of time when the user is actively browsing your website (up to 30 minutes of inactivity); one user usually visits several pages within one session
- Pageviews – a pageview is counted every time a visitor visits a page; if the page is visited repeatedly by one user, multiple page views are counted (so the number of pageviews is always higher than the number of sessions).
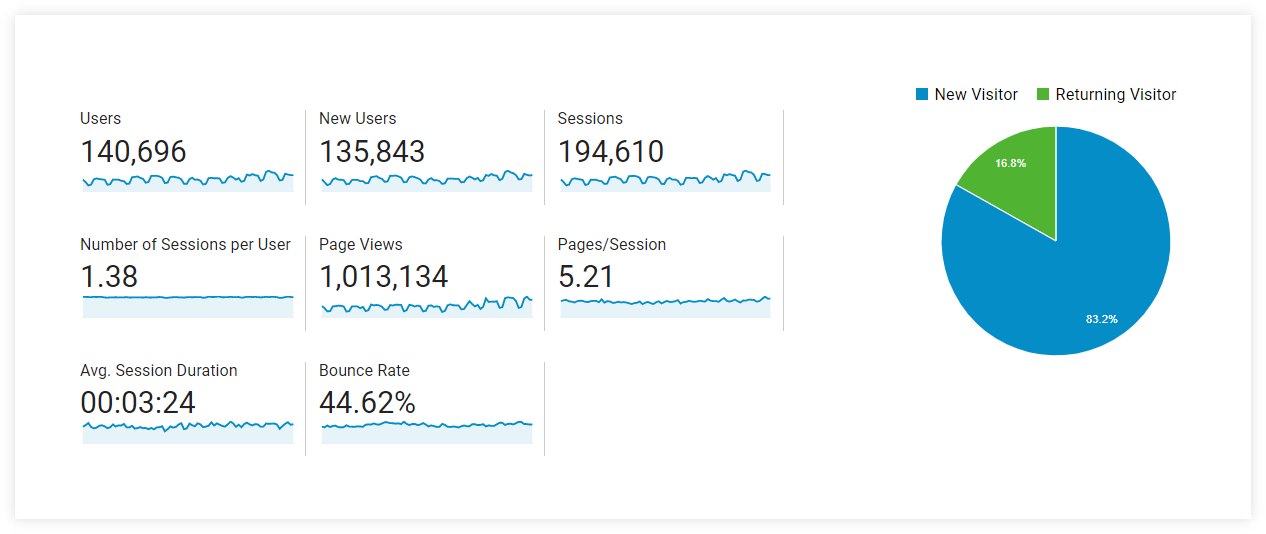
Tip: An interesting engagement metric is the percentage of returning visitors. You’ll find it in the Audience Overview.
Bounce rate
The bounce rate metric shows the percentage of visitors who left the website without any action. A high bounce rate is not always a bad thing but in general, a lower bounce rate is almost always better.
Tip: Always compare the bounce rates of similar types of pages (e.g. blog post to blog post, landing page to landing page) to get relevant insights. Read more in our SEOpedia post on bounce rate.
Pages per session
This metric shows you how many pages a user visited within one session on average.
Pages per session metric can be a good indicator of the overall engagement. To improve the ratio, think about the ways to make your visitors click on other pages:
- Add related products/posts
- Insert “further reading” boxes
- Link to relevant pages in the text
Average time on page / Session duration
Both time-based metrics in Google Analytics have their issues when it comes to accuracy so we don’t recommend drawing any big conclusions based on these two metrics.
If you want to choose one of them, the average time on page is a better indicator of how much time people spend on your page. (here’s an explanation why)
Rank tracking
Rank tracking is the process of monitoring how your website performs in search engines for your most important keywords.
Unlike Google Search Console and Google Analytics, rank trackers are usually much simpler but very effective tools.
Here’s what the tracking dashboard looks like in SERPWatcher:
The main advantages of using a rank tracker:
- You can see daily updated positions of your most important keywords
- You are able to quickly detect any significant ranking drops or spikes through automatic reports and alerts
- You can track your progress is a specific location (e.g. country or city)
- You also see relevant metrics to see the actual impact of the changes (e.g. the search volumes of the keywords)
- You can track your competitors to compare your results
Tip: Look at the data realistically. Although it’s great if you moved from position 90 to position 45 for that big keyword, remember that it’s usually just the 1st SERP that brings organic traffic.
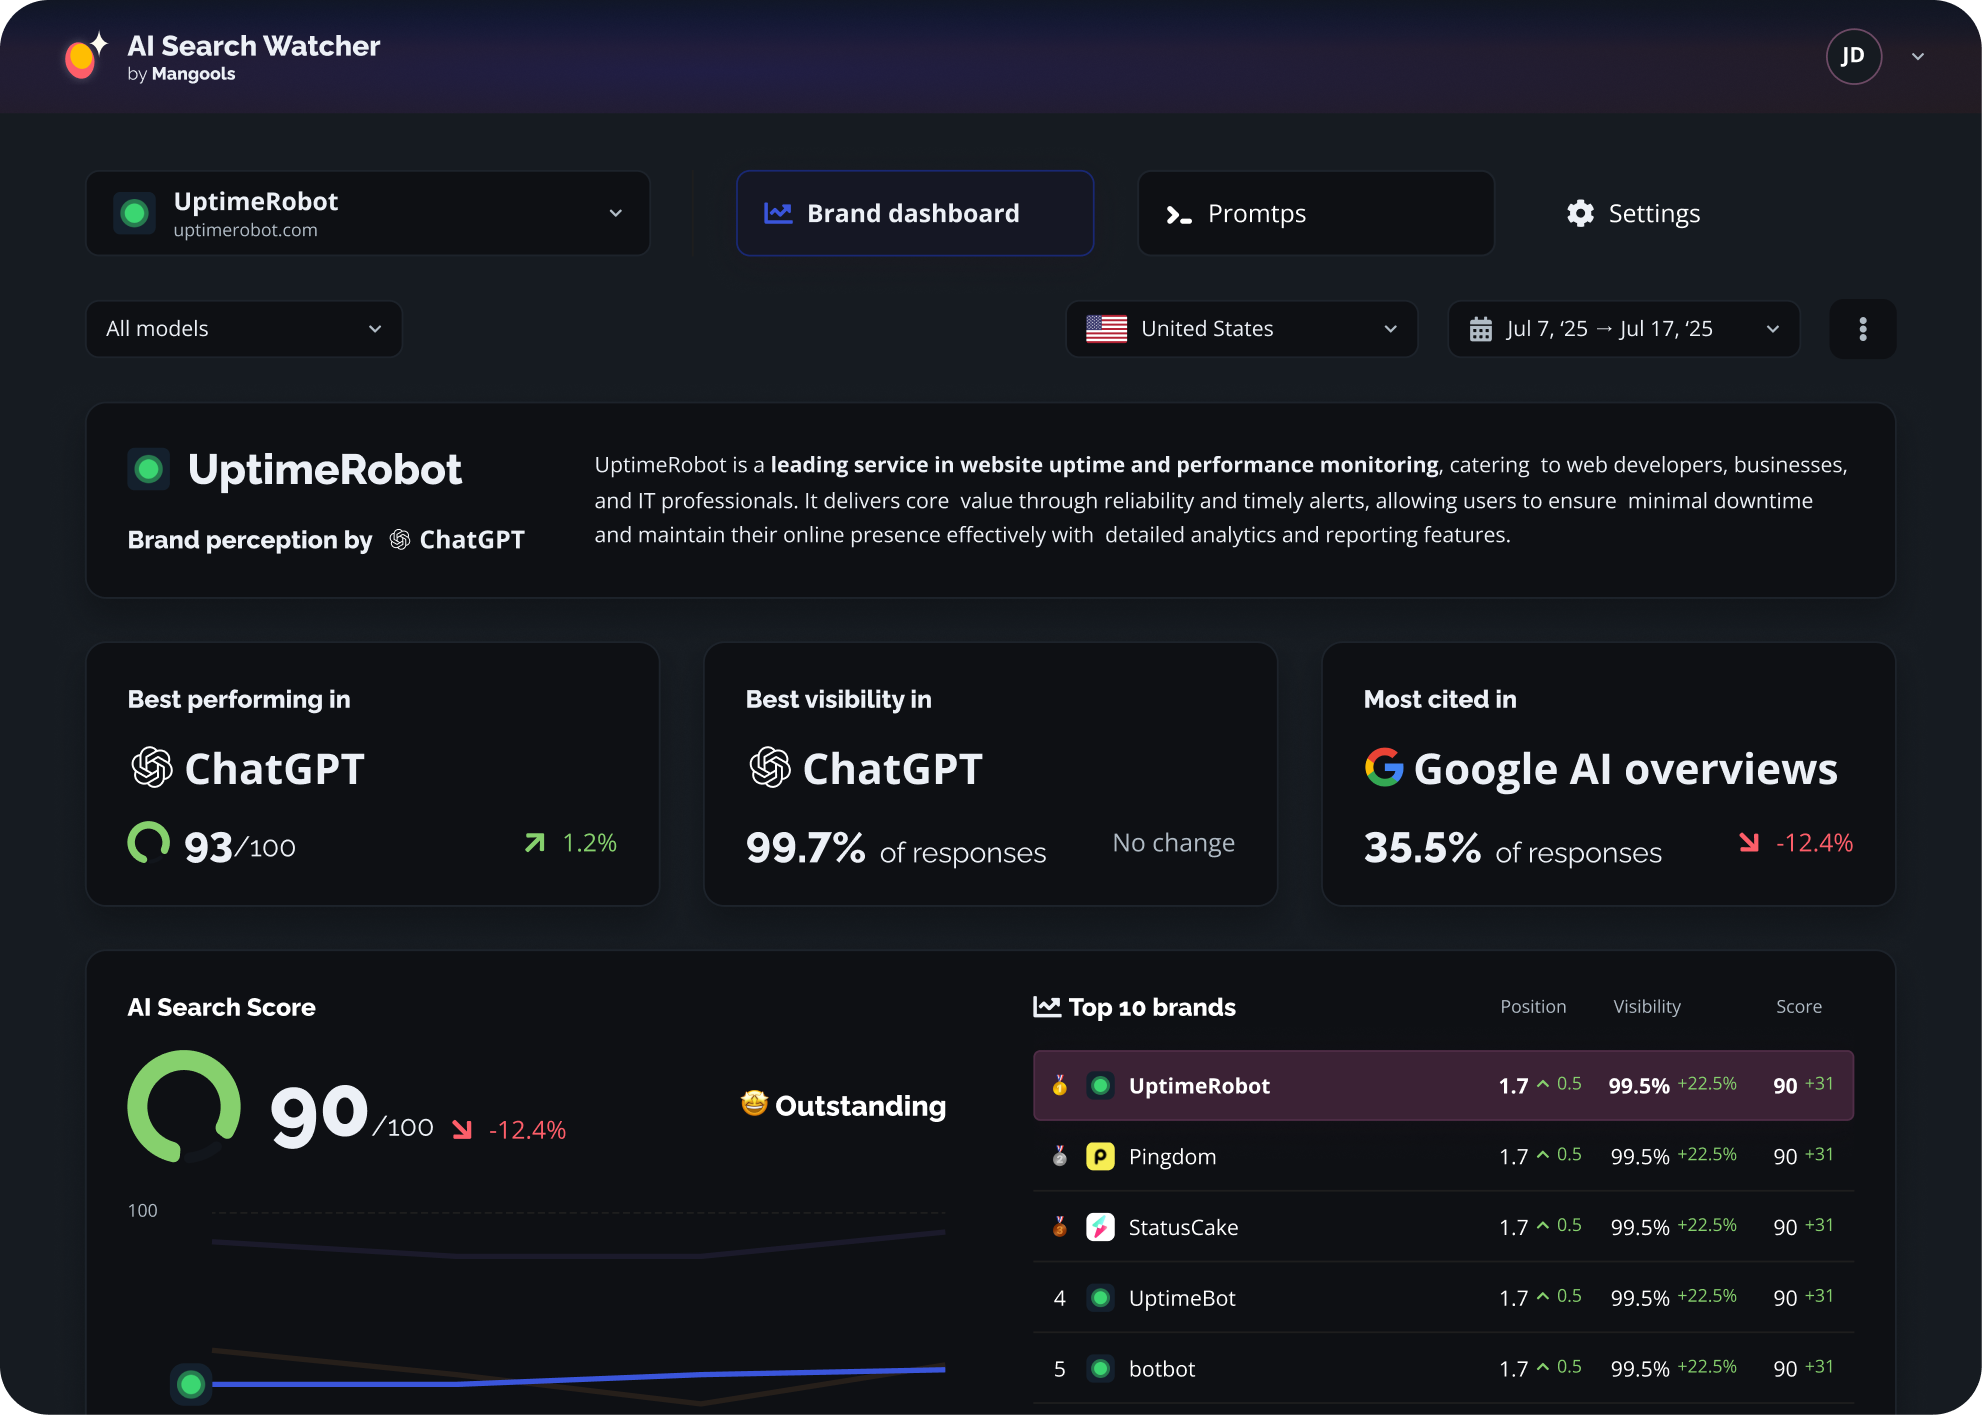
AI search monitoring
Tracking the presence of your brand and website in AI engines is another important step in rank tracking – you can use our free Mangools AI Search Watcher – a powerful LLM-based rank tracker that helps you monitor how your brand is mentioned across major AI search engines like ChatGPT, Gemini, Claude, Mistral, and Llama.
It runs each prompt multiple times to generate reliable average rankings, visibility scores, and citation insights
You can also track competitors side-by-side, see how AI “perceives” your brand, and use prompt suggestions tailored to your business — all helping you shape your Generative Engine Optimization (GEO) strategy.
Analytics tips and best practices
We’ll conclude this chapter with some useful tips on how to effectively measure your performance.
Watch the overall progress, dig into details
Your performance will most probably fluctuate from day to day. That’s why it’s always good to look at the bigger picture rather than obsessing about every little change on a daily basis.
On the other hand, you can almost never draw conclusions from default reports if there is an unpredicted change. The first rule of analytics is to always dig as deep as possible to find the root cause.
Understand the metrics
Remember that you don’t need to analyze all the metrics all the time, but it is good to have a basic overview of what they mean to avoid data misinterpretation.
Always try to understand the context
Don’t take the data as granted but look for the reasons why something happened.
For example, when it comes to troubleshooting the ranking drops, there may be various reasons, both internal and external:
- Recent changes on the website
- Google algorithm update
- Technical issues or website outage
- Google manual action
- An error in the rank tracking tool
A thorough examination of Google Search Console, Google Analytics and your rank tracker should give you a better understanding of the problem – which means you’ll be able to make an informed decision about your next steps.
Use annotations to add context
Google Analytics and most rank trackers will allow you to create annotations to add context to your analytics dashboards.
You can annotate your actions or specific events to see whether they had any influence on the performance of your website. For example:
- Google algorithm updates
- Any significant changes on your website
- Article updates
- Start of a marketing campaign
- Website problems and outages
- Seasonal events (e.g. Black Friday)
Set up alerts to be notified about any dramatic changes
Most analytic tools will allow you to set up email alerts that will notify you if certain conditions are met.
This is a great way to stay informed about any dramatic changes without spending all the time glued to the screen with the data tables.
Source link