What Is a Google Analytics Dashboard?
A Google Analytics dashboard is a customizable report that’s used to monitor all the key metrics for a website.
Google Analytics 4 (GA4) doesn’t have a built-in “Dashboards” feature from Universal Analytics (GA4’s predecessor), but you can still create a similar setup in GA4.
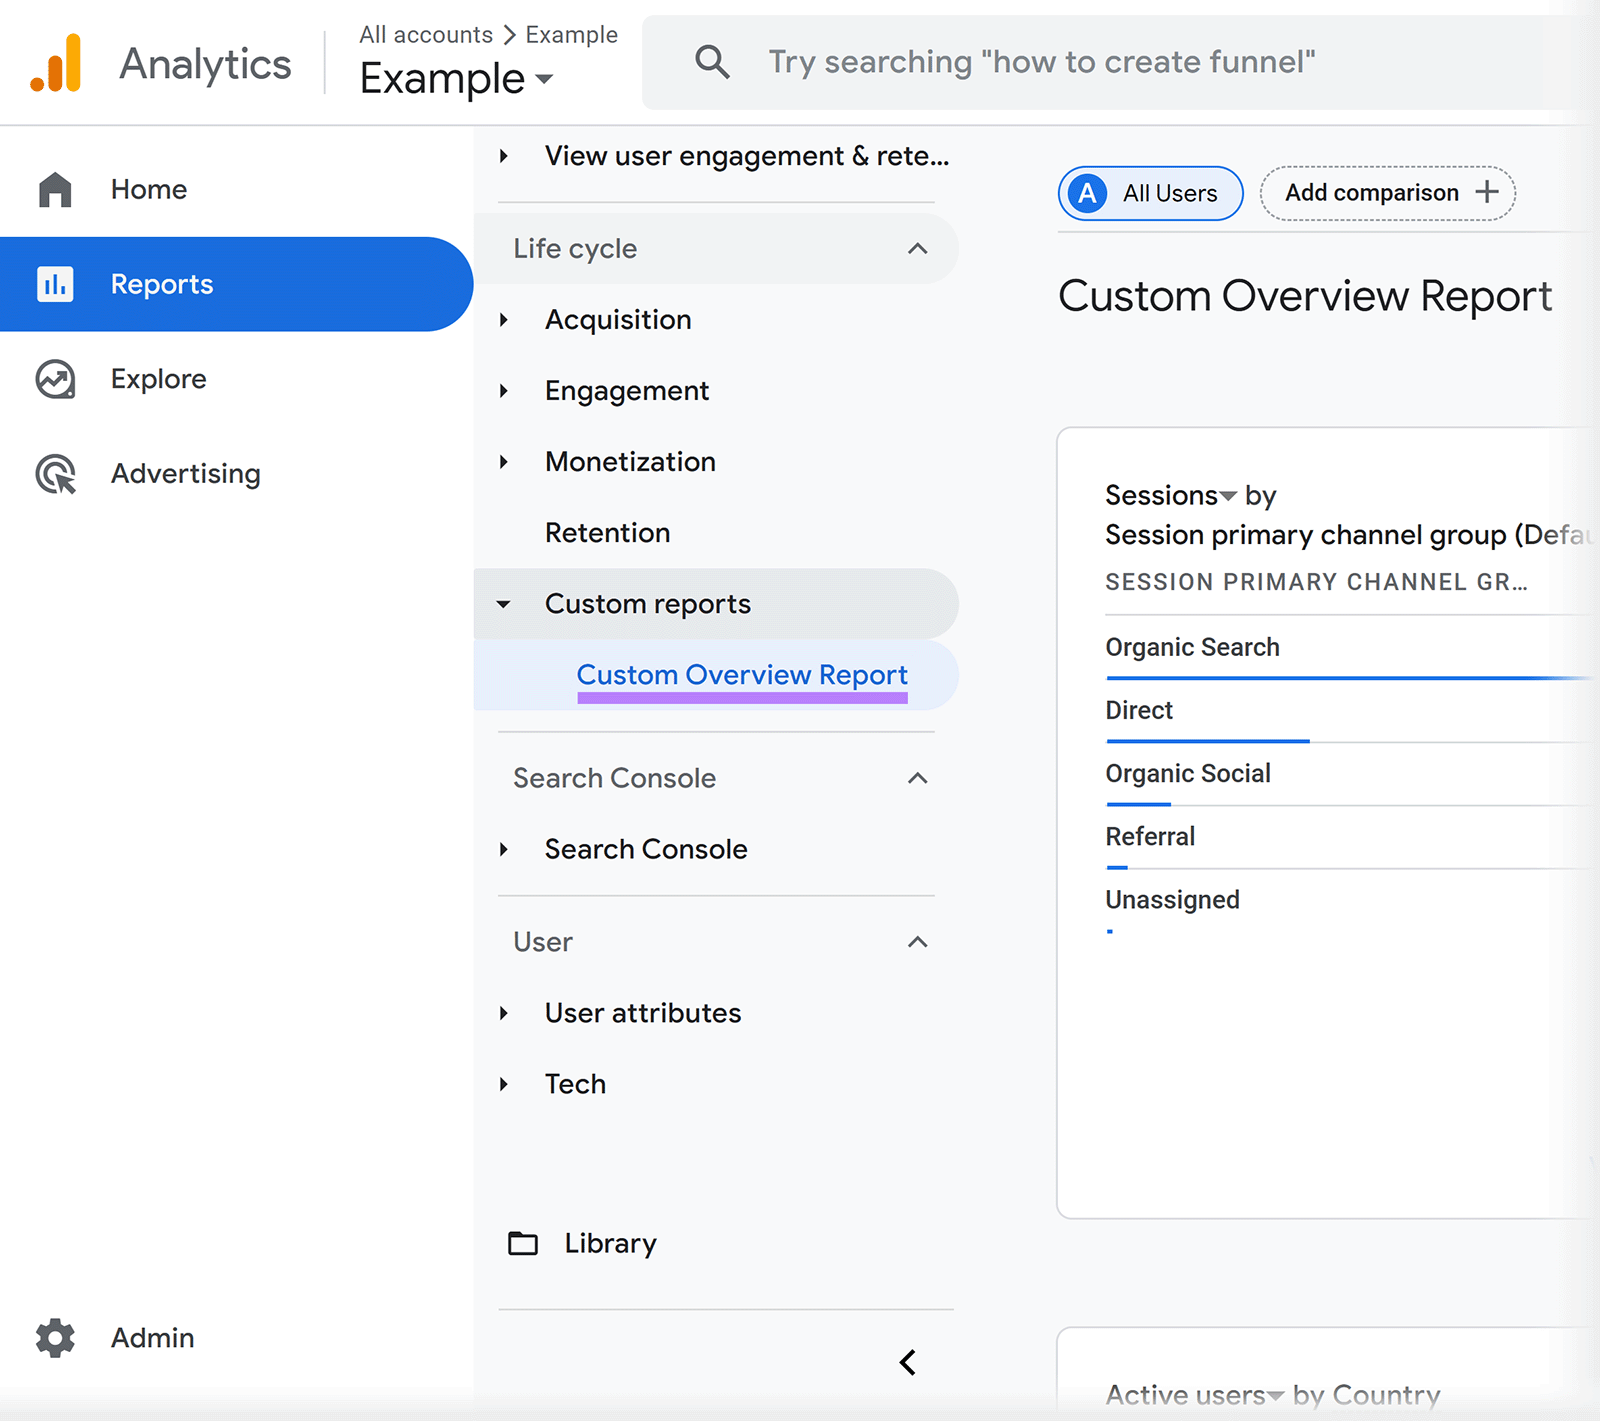
Here’s an example of a dashboard built in Google Analytics 4:
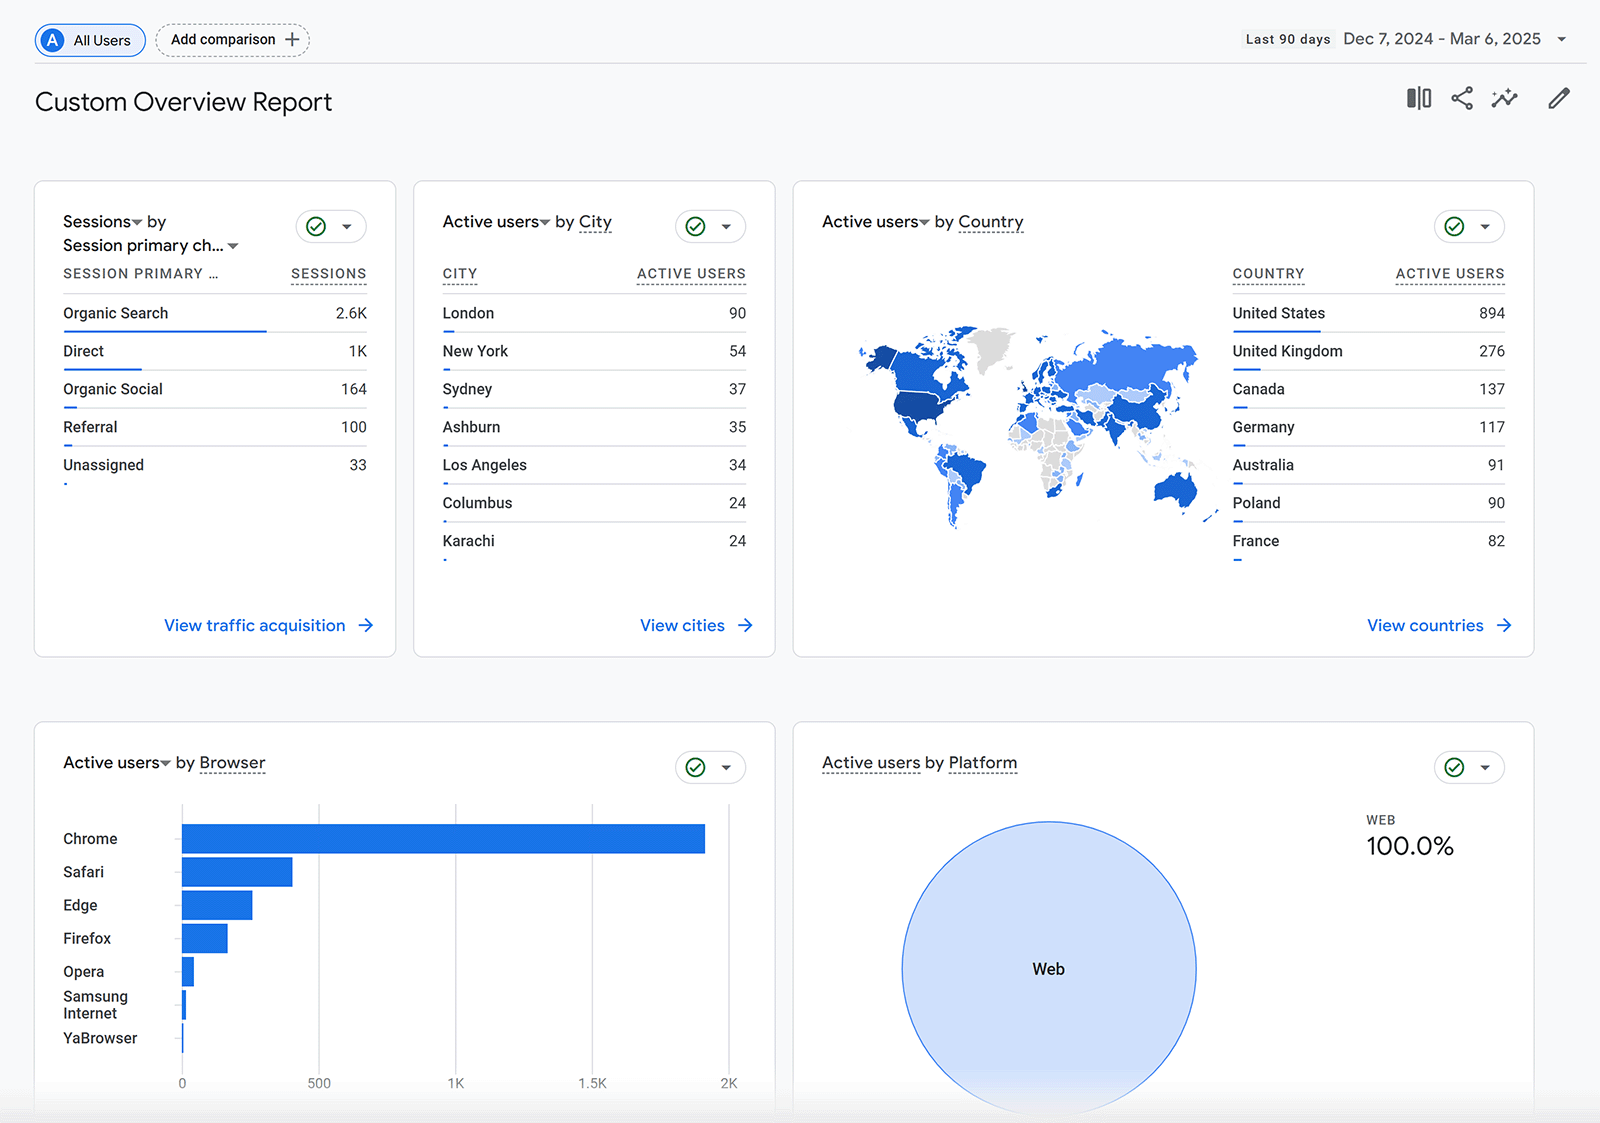
Some users find it challenging to create dashboards in GA4 given the new platform requires more manual configuration. But it’s very doable if you learn the basics.
Benefits of Using a GA Dashboard
A Google Analytics dashboard places important metrics in one location, so you can make informed decisions faster.
With a Google Analytics dashboard, you can:
- Share data with your team, so everyone has access to the same insights
- Spot trends with data visualization methods like bar graphs and charts
- Automate reporting instead of pulling manual data every day
- Feature the metrics that best reflect your business goals
How to Create a Custom Google Analytics 4 Dashboard
You can create a custom GA4 dashboard by creating a new report, by customizing a report that already exists and, and using explorations (advanced tools for deeper analysis).
Here’s an overview of those methods:
1. Create a Report
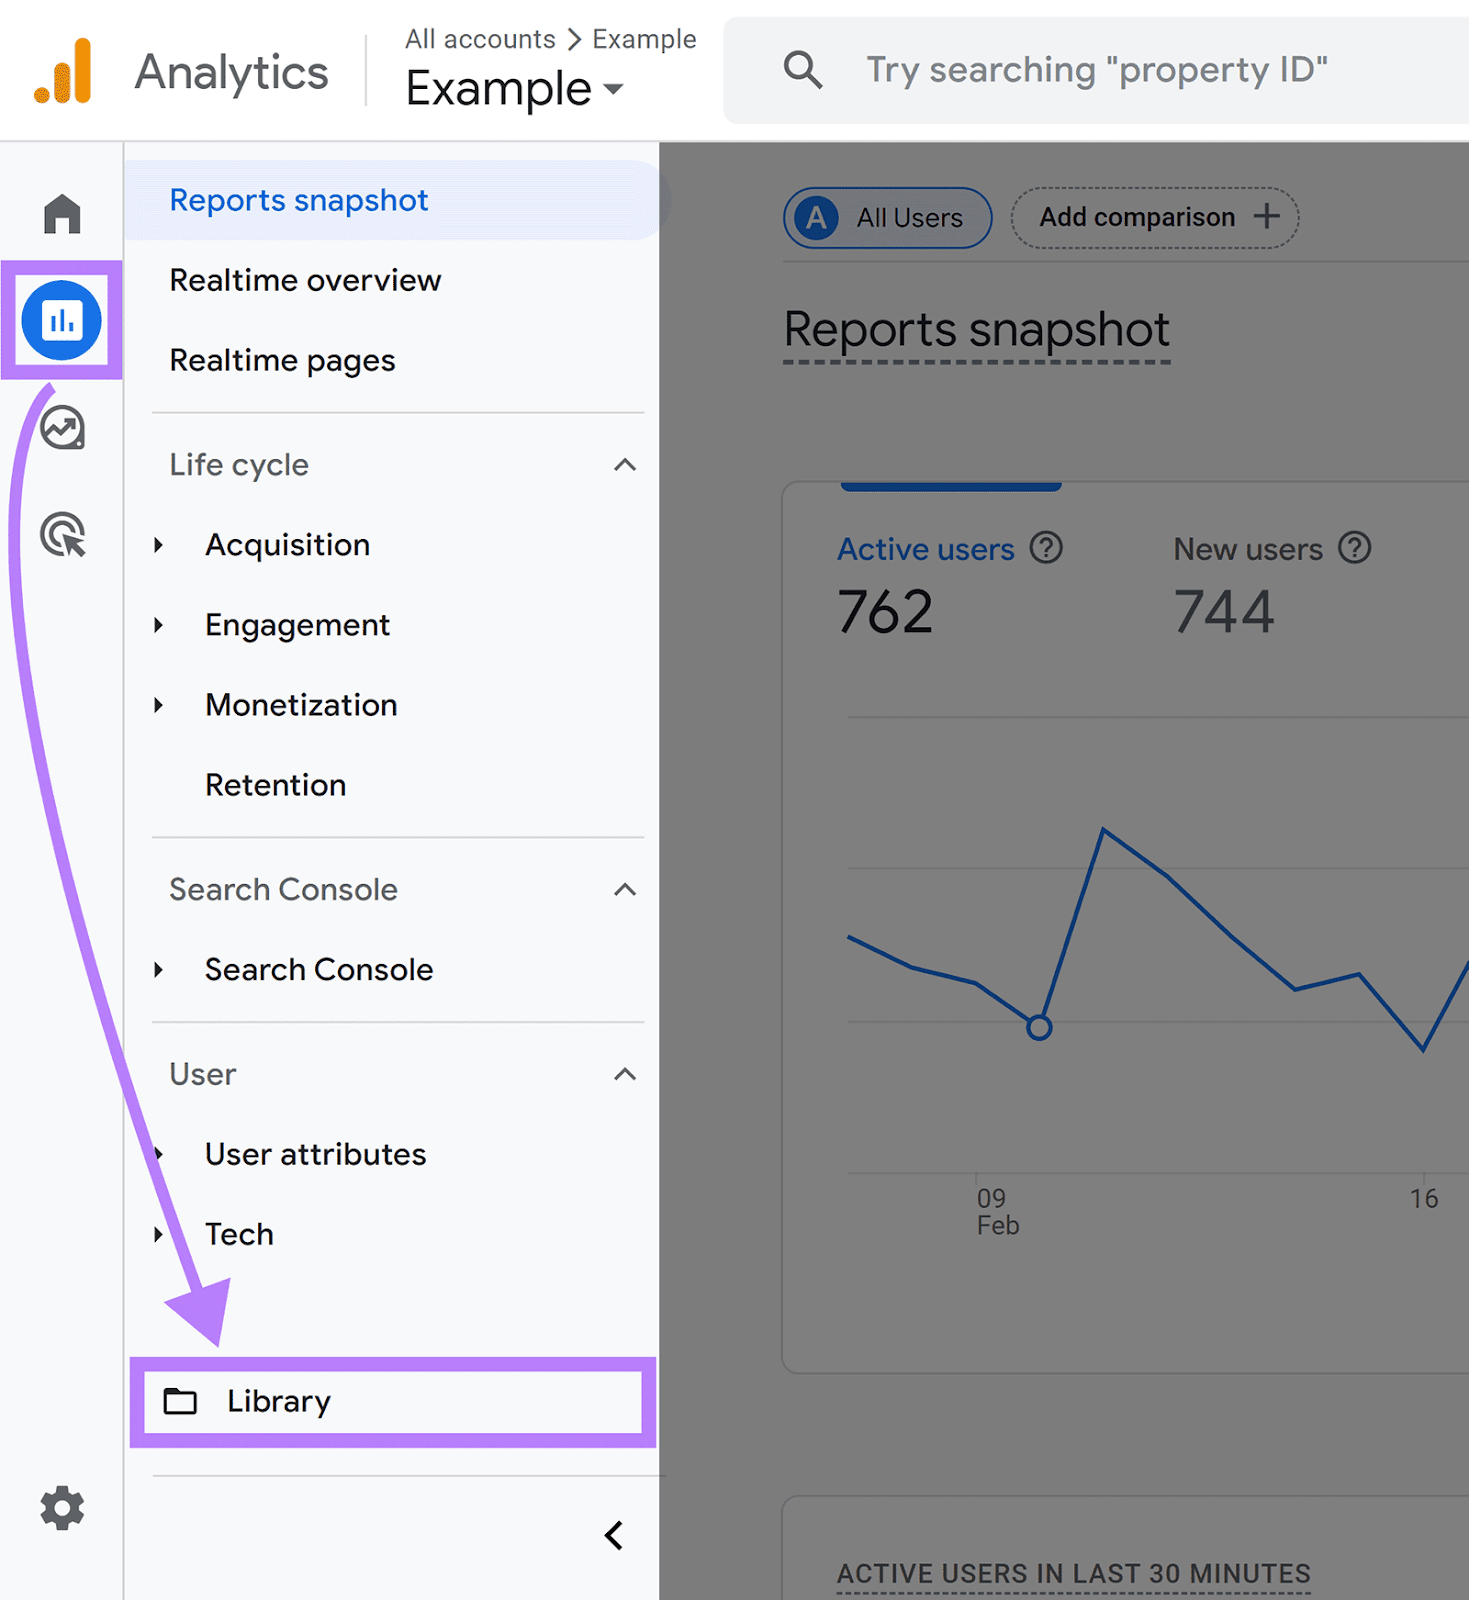
In your GA4 property, click “Reports” > “Library.”
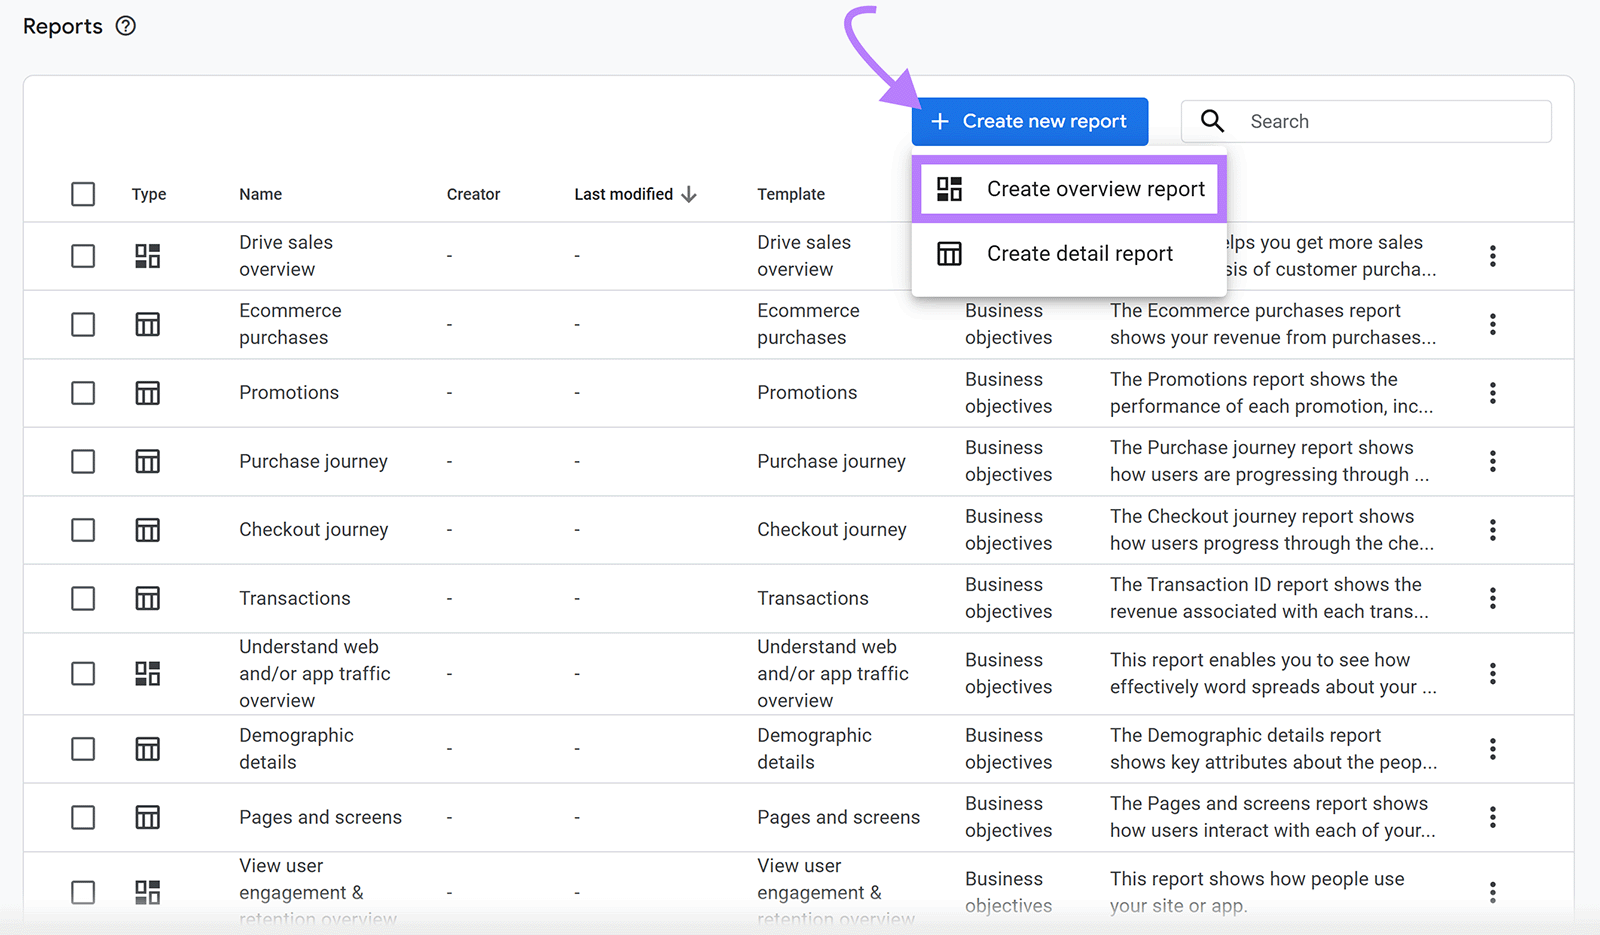
Click “Create new report” and select either “Create overview report” (for a high-level summary) or “Create detail report” (for deeper analysis).
This example uses “Create overview report.”
2. Customize an Existing Report
You can also customize existing reports if there’s one that’s close to what you need.
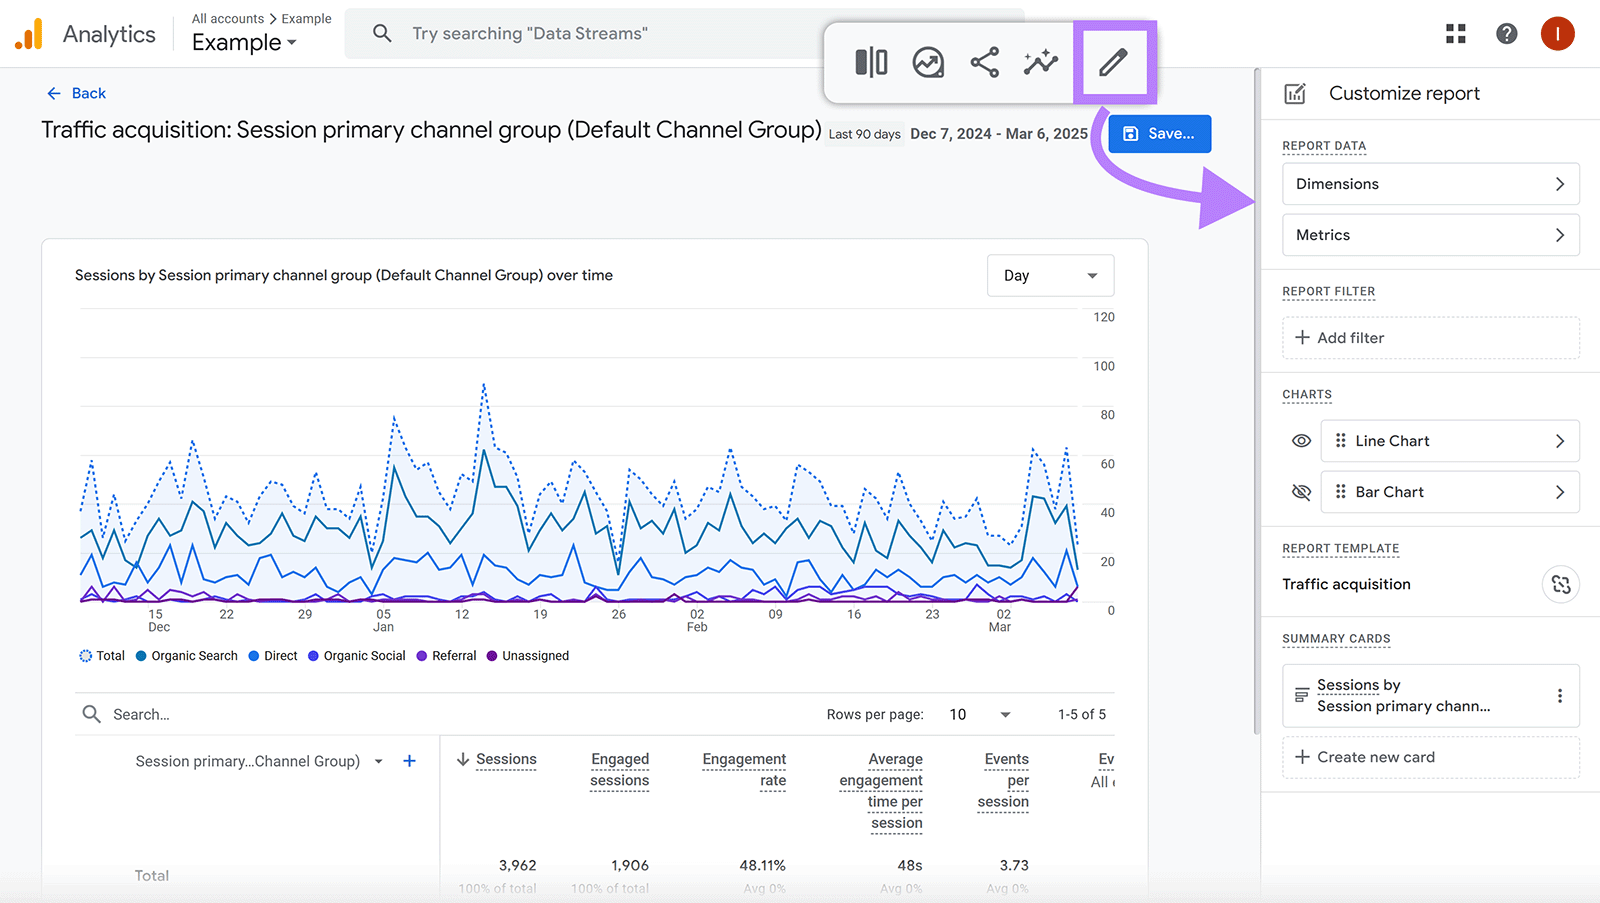
While viewing a GA4 report, click the pencil icon.
A sidebar will then let you add or remove filters, cards (visual elements that display data), metrics, and dimensions. Adjust the report to suit your needs.
If you opt to use cards, choose “+ Create new card” and choose cards that reflect your goals and key metrics. So you can interpret and act on your report data more effectively.
For example, if you want to analyze SEO performance, select cards showing organic (unpaid) search traffic.
Go to the “Summary Cards” and “Other Cards” tabs and select the ones you want. Click the drop-down to customize the cards.
Click “Add Cards”
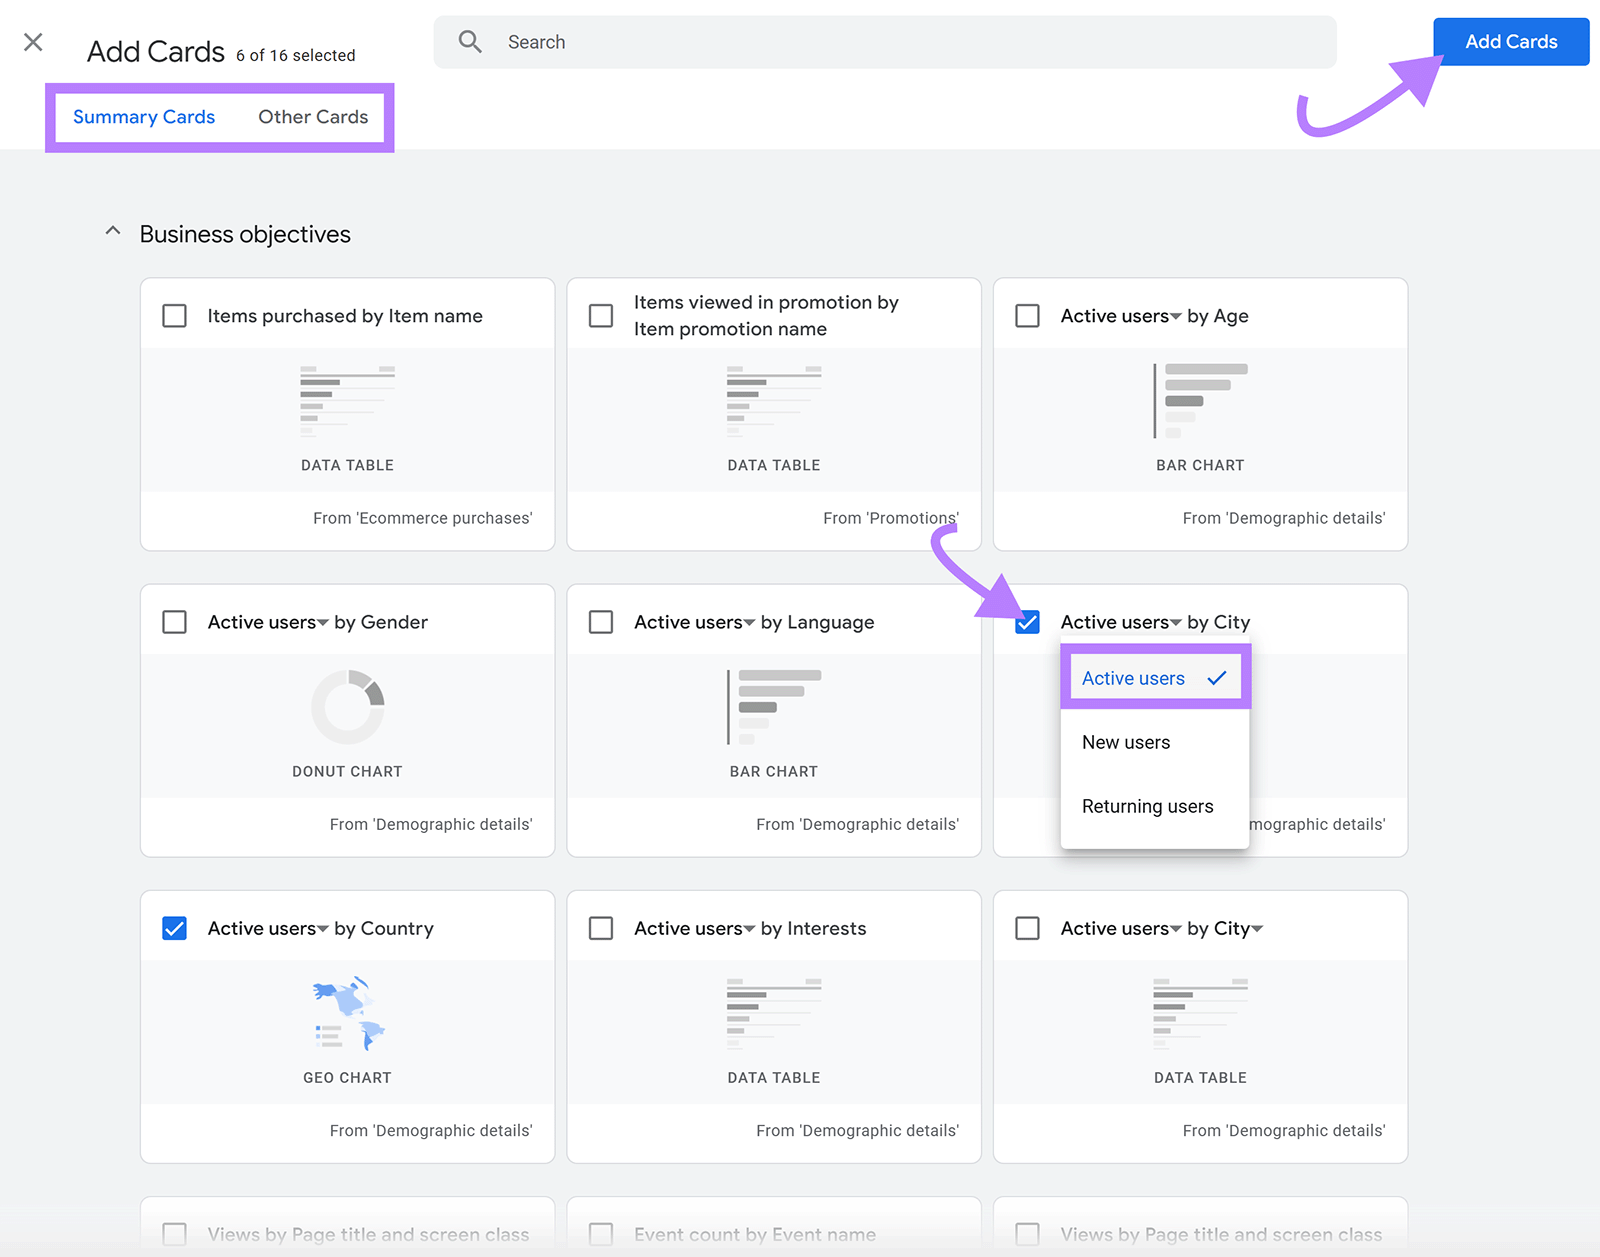
When you’re finished, click the blue “Save” button and name the report. Then, add your report to the sidebar menu by going to “Library.”
Find the collection (a set of reports) where you want your custom report to appear. Click the three dots next to the collection and select “Edit.”
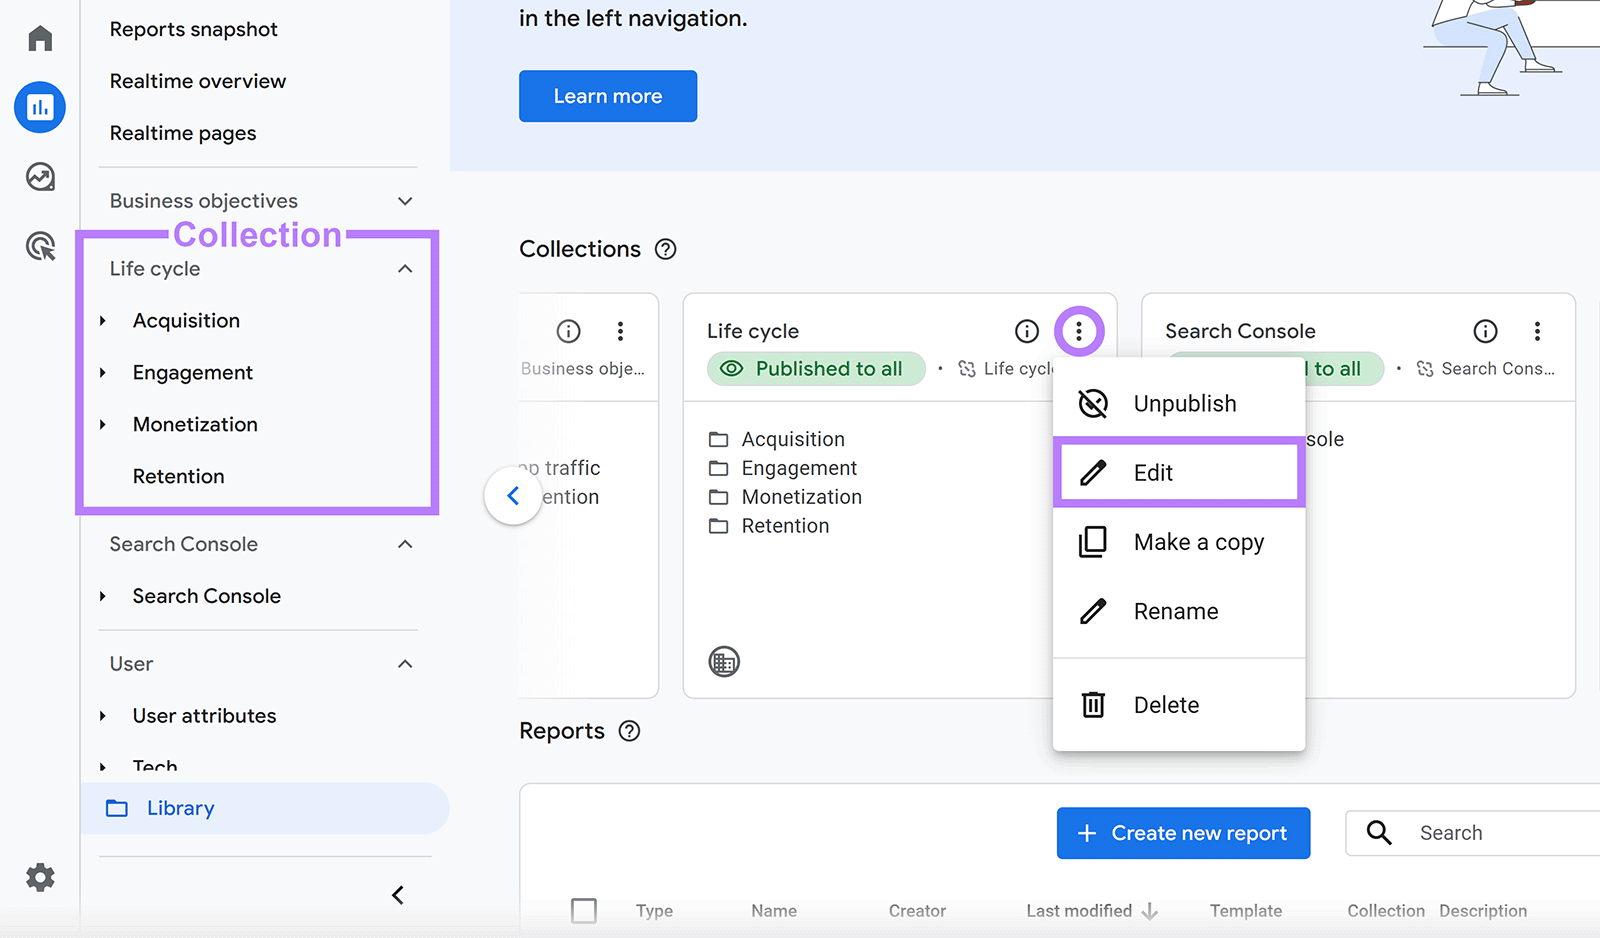
Select “+ Create new topic,” name your topic, and click “Apply.”
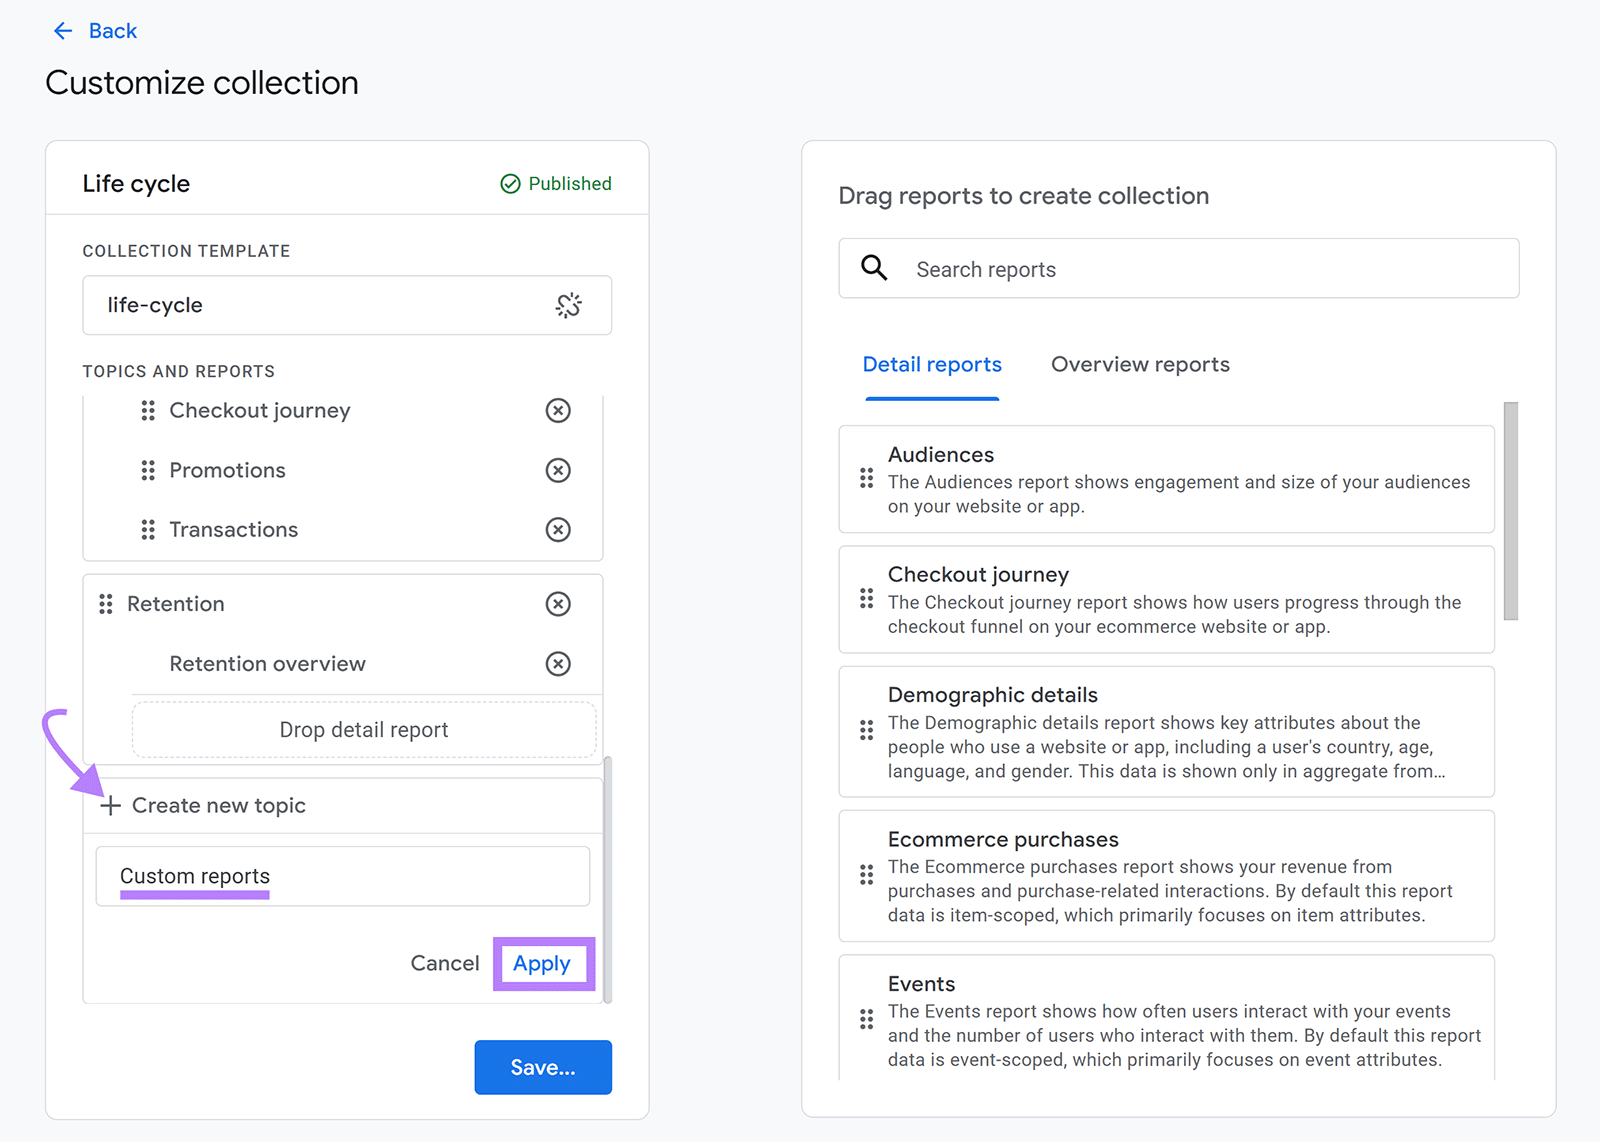
Drag your custom report from the right-hand menu into the left-hand menu. Click “Save.”
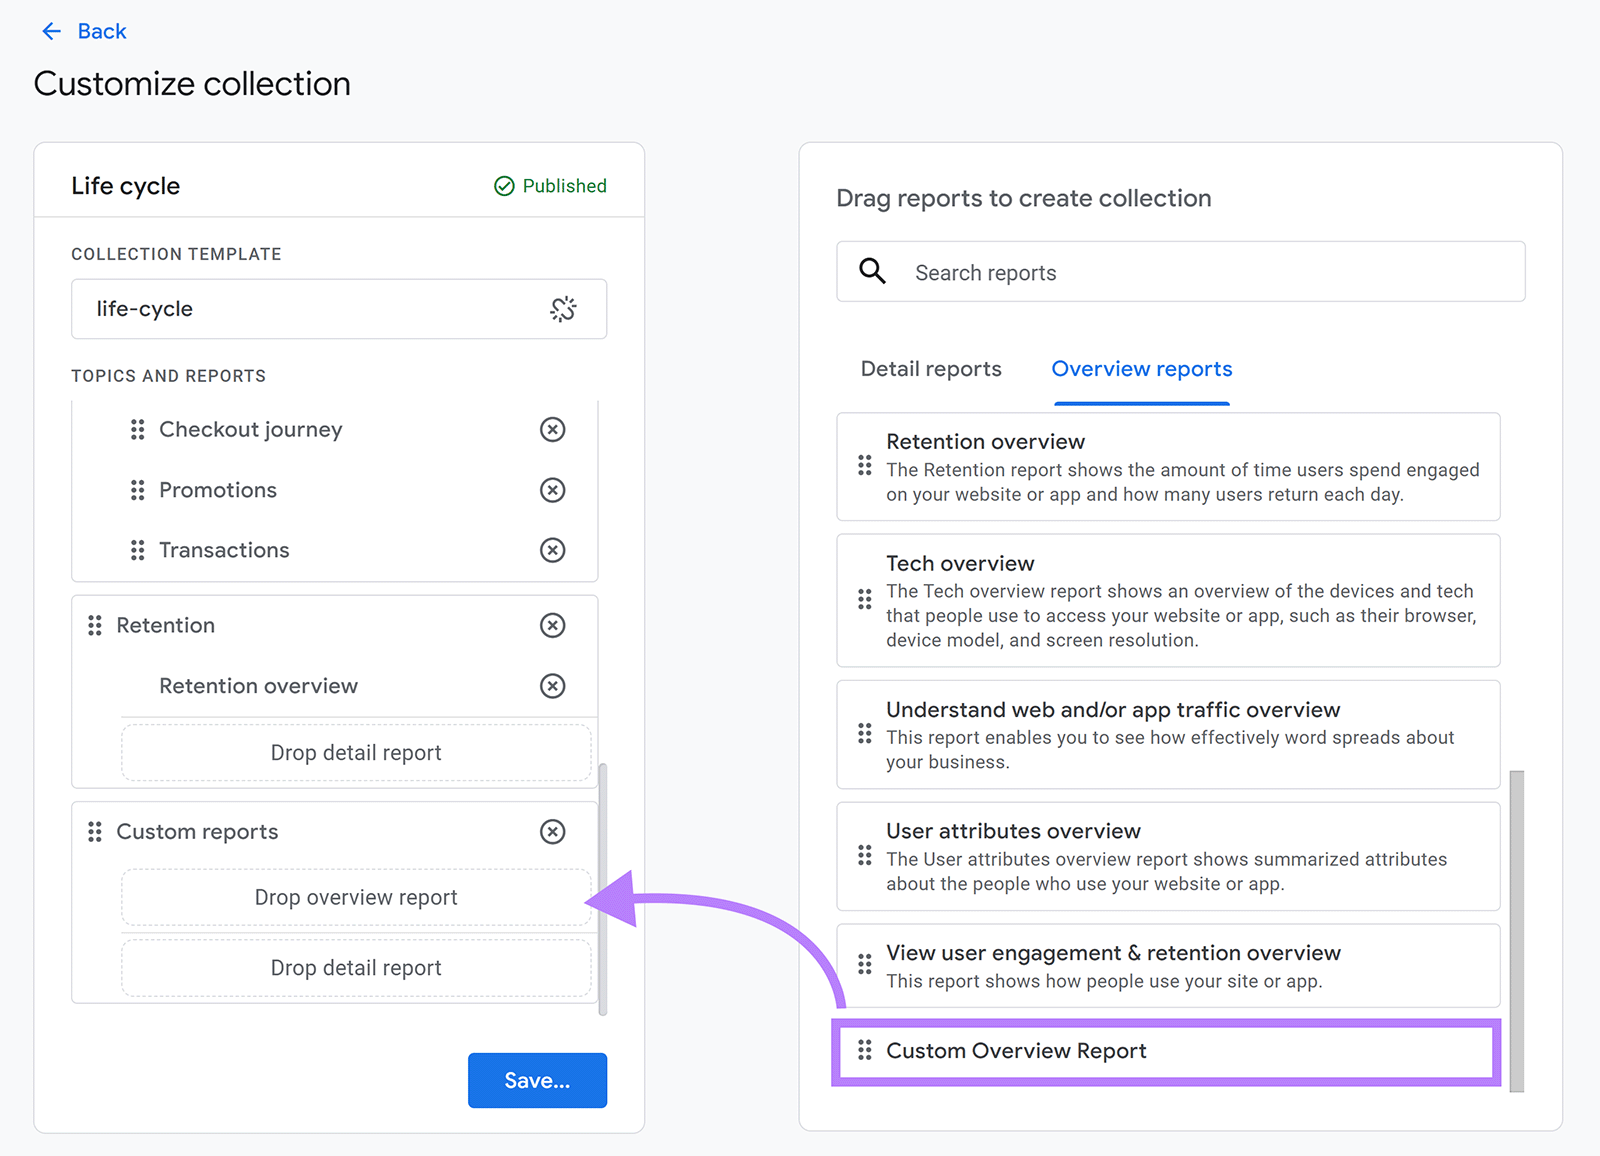
Your customized report is now accessible in the main menu.
3. Use Explorations
Explorations offer advanced analysis beyond standard metrics.
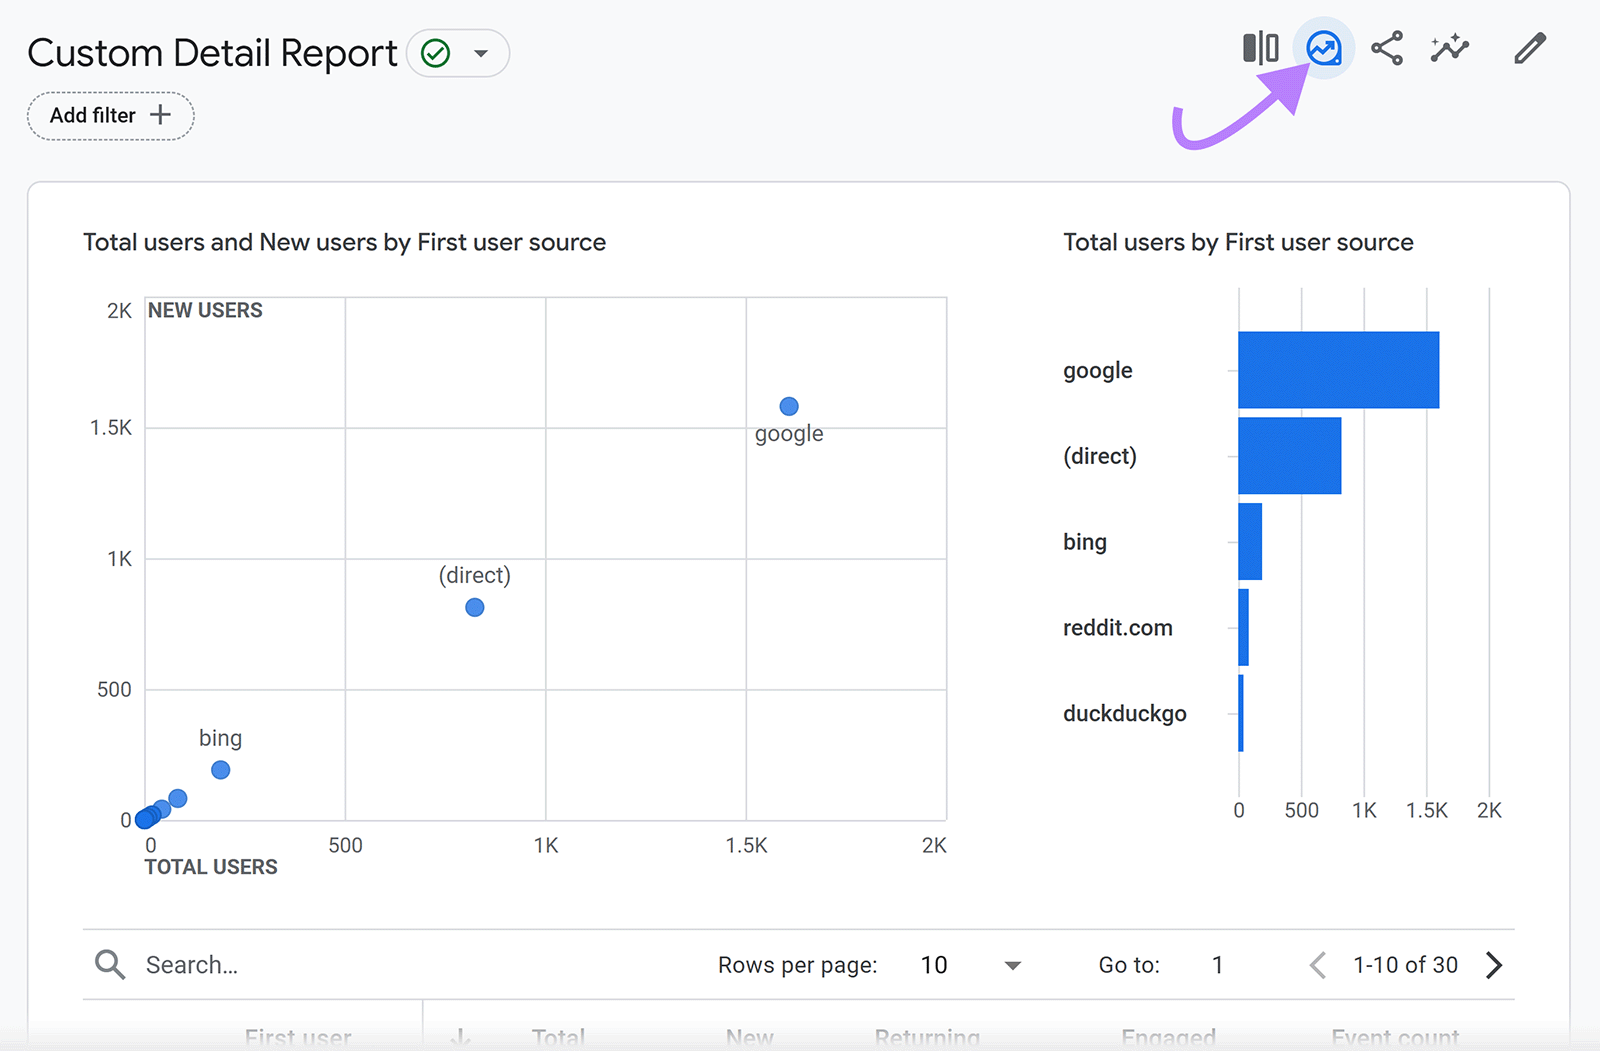
You can start an exploration from an existing detailed report by clicking the icon shown below.
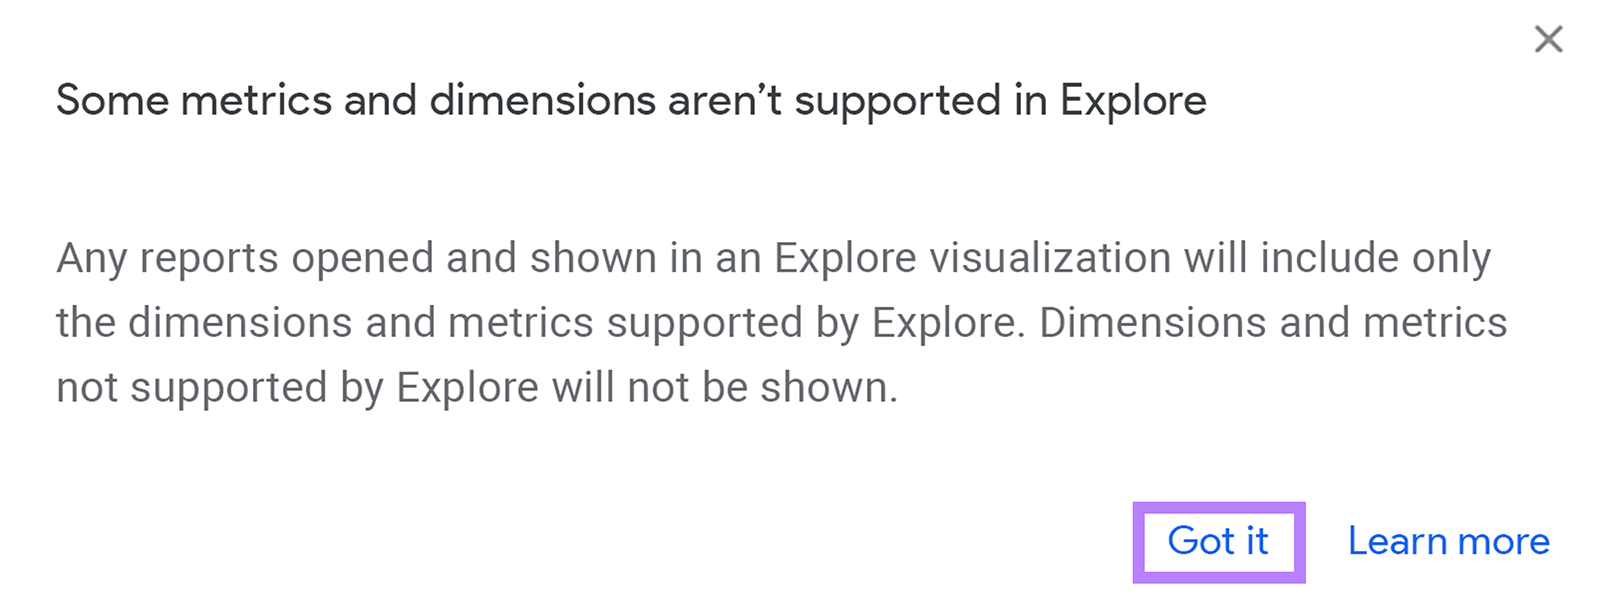
A notice appears if some metrics or dimensions from your report aren’t supported in explorations. Click “Got it” to proceed.
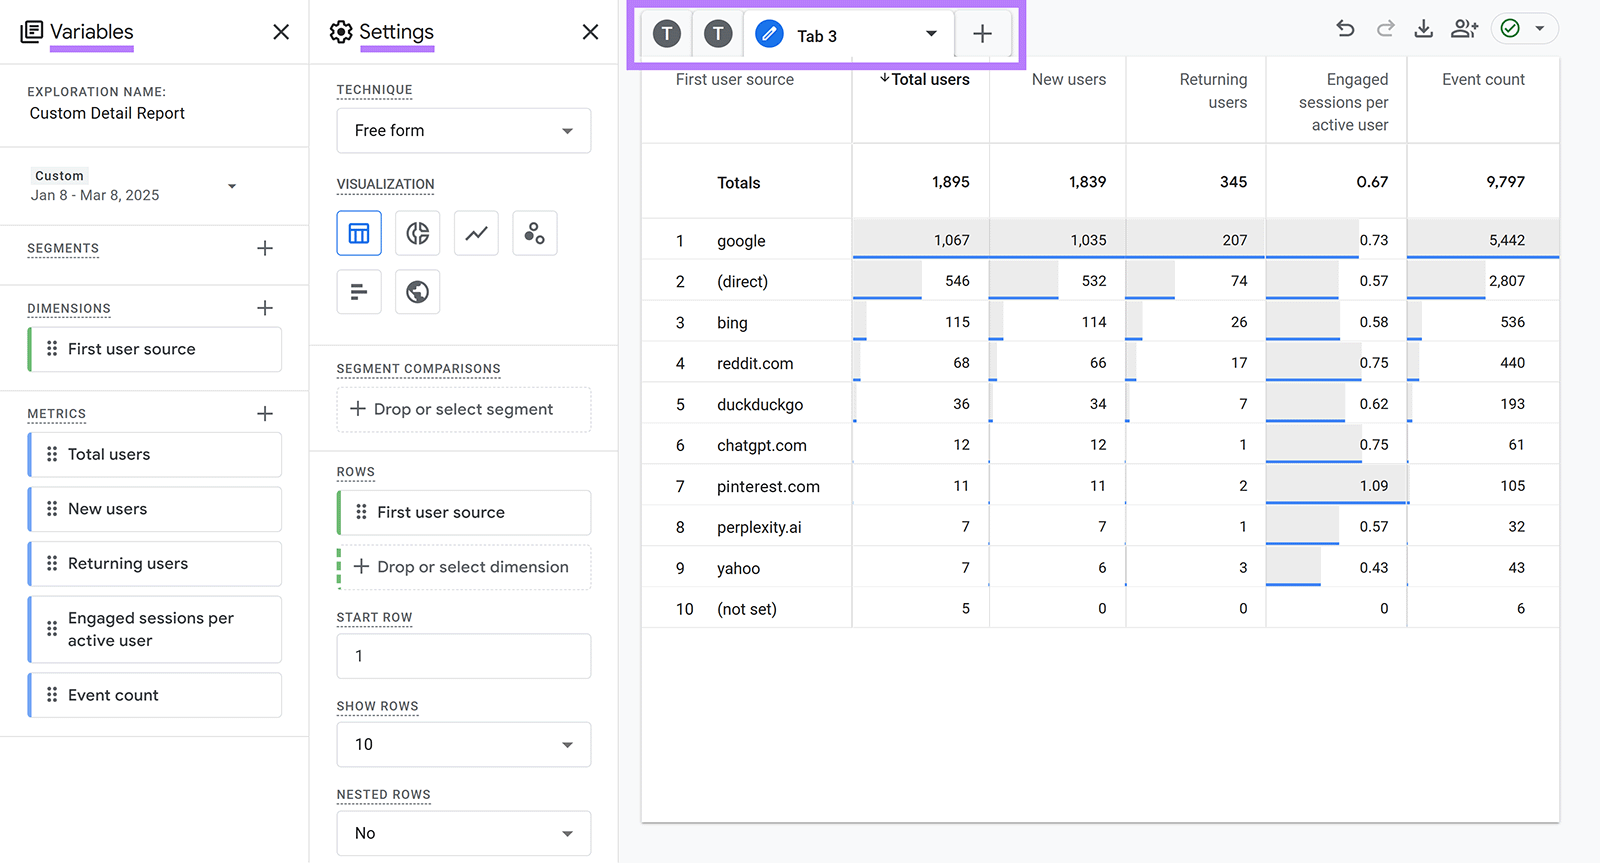
GA4 opens an exploration with data from your custom report.
Click into the report tabs and customize the report by adding or removing variables—or adjusting the report settings. To analyze specific patterns, trends, and user behaviors in more detail.
How to Share or Export Your Dashboard
You can share custom GA4 reports by email, link, or downloadable file.
Open your report and click the share icon. Select your preferred sharing method.
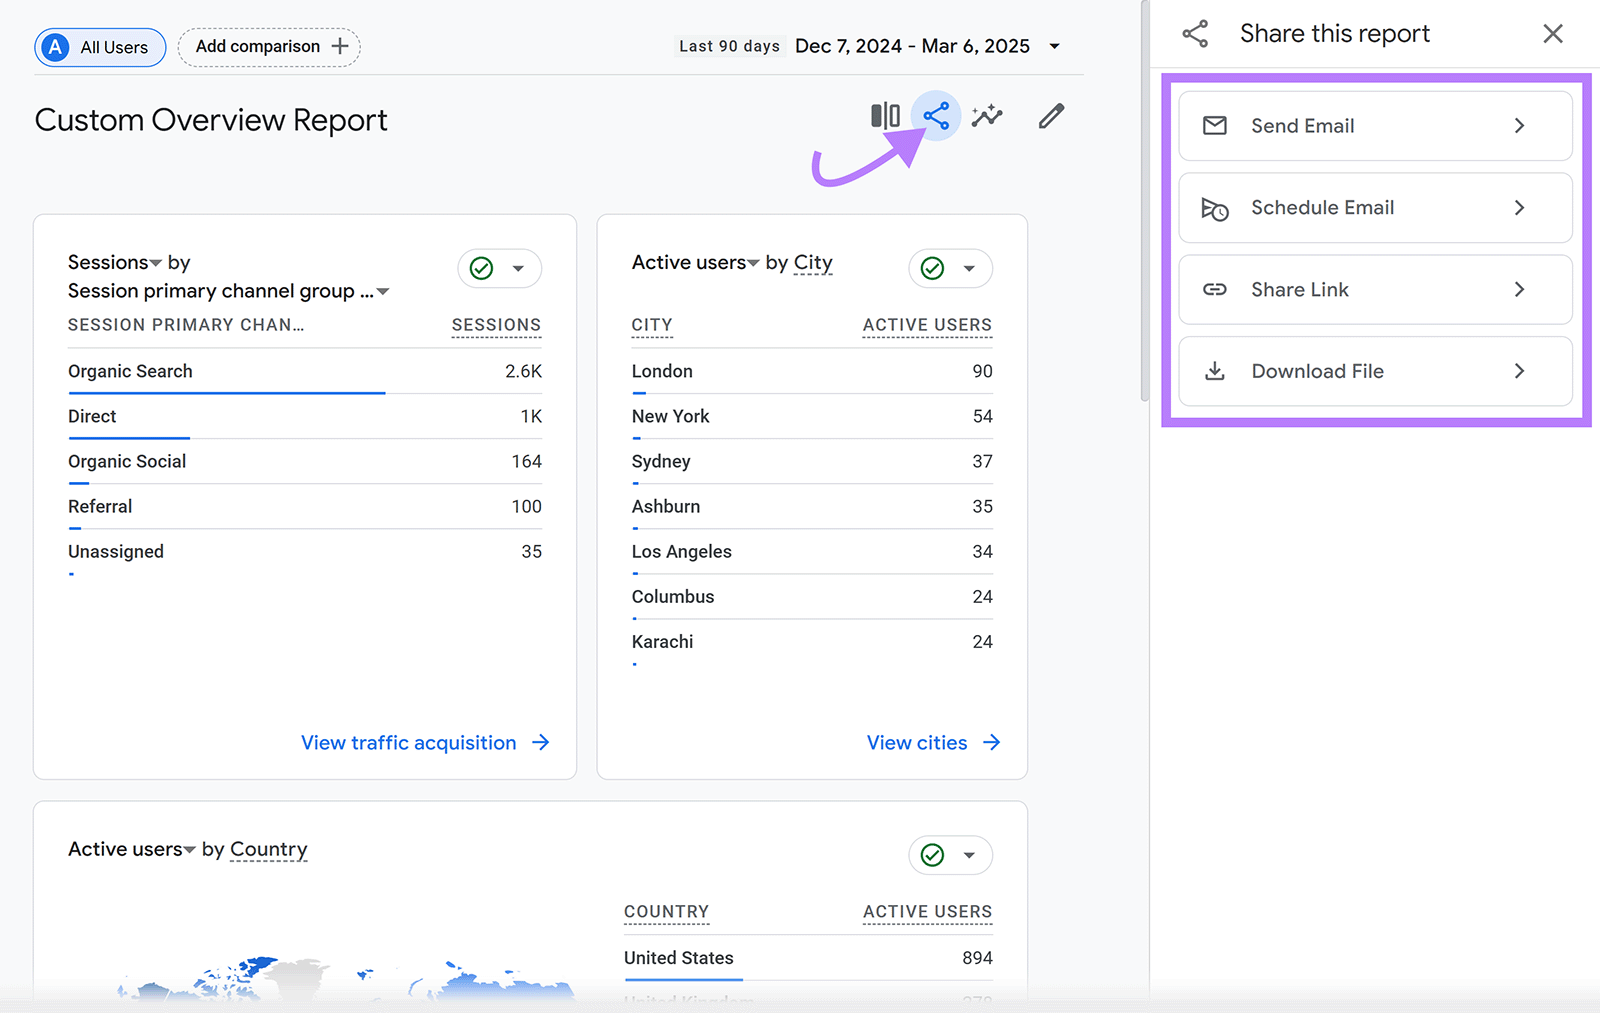
Users with access to your Google Analytics property can also view your reports.
To share a dashboard you built with explorations, you can either choose the share option or the export option in the upper right corner.
5 GA4 Analytics Reports to Use as Dashboard Templates
These five existing GA4 reports serve as great dashboard templates that let you gather valuable insights about your site’s traffic and engagement.
Organic Search Traffic Report
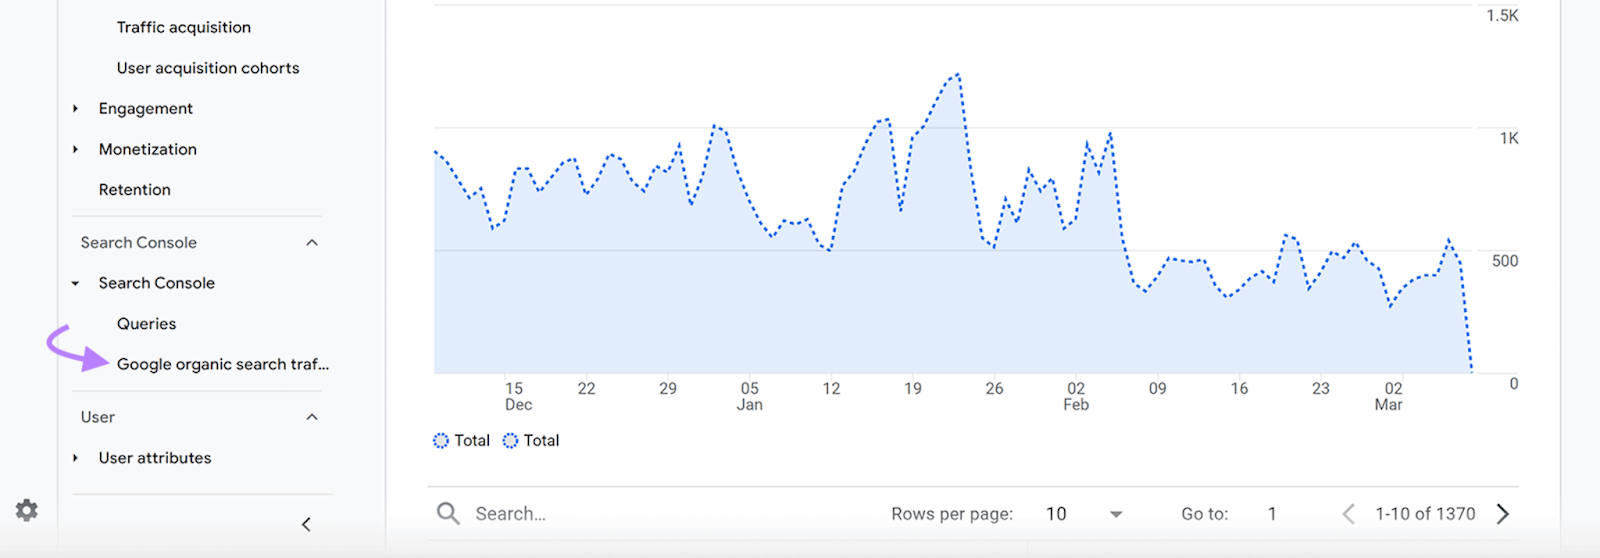
The Google organic search traffic report shows insights for each page on your site, including the number of impressions in search results and the clicks the page received.
It offers a broad view of your site’s search performance and helps you find high- and low-performing pages.
To see this report, go to “Reports” > “Search Console” > “Google organic search traffic.”
Traffic Acquisition Report
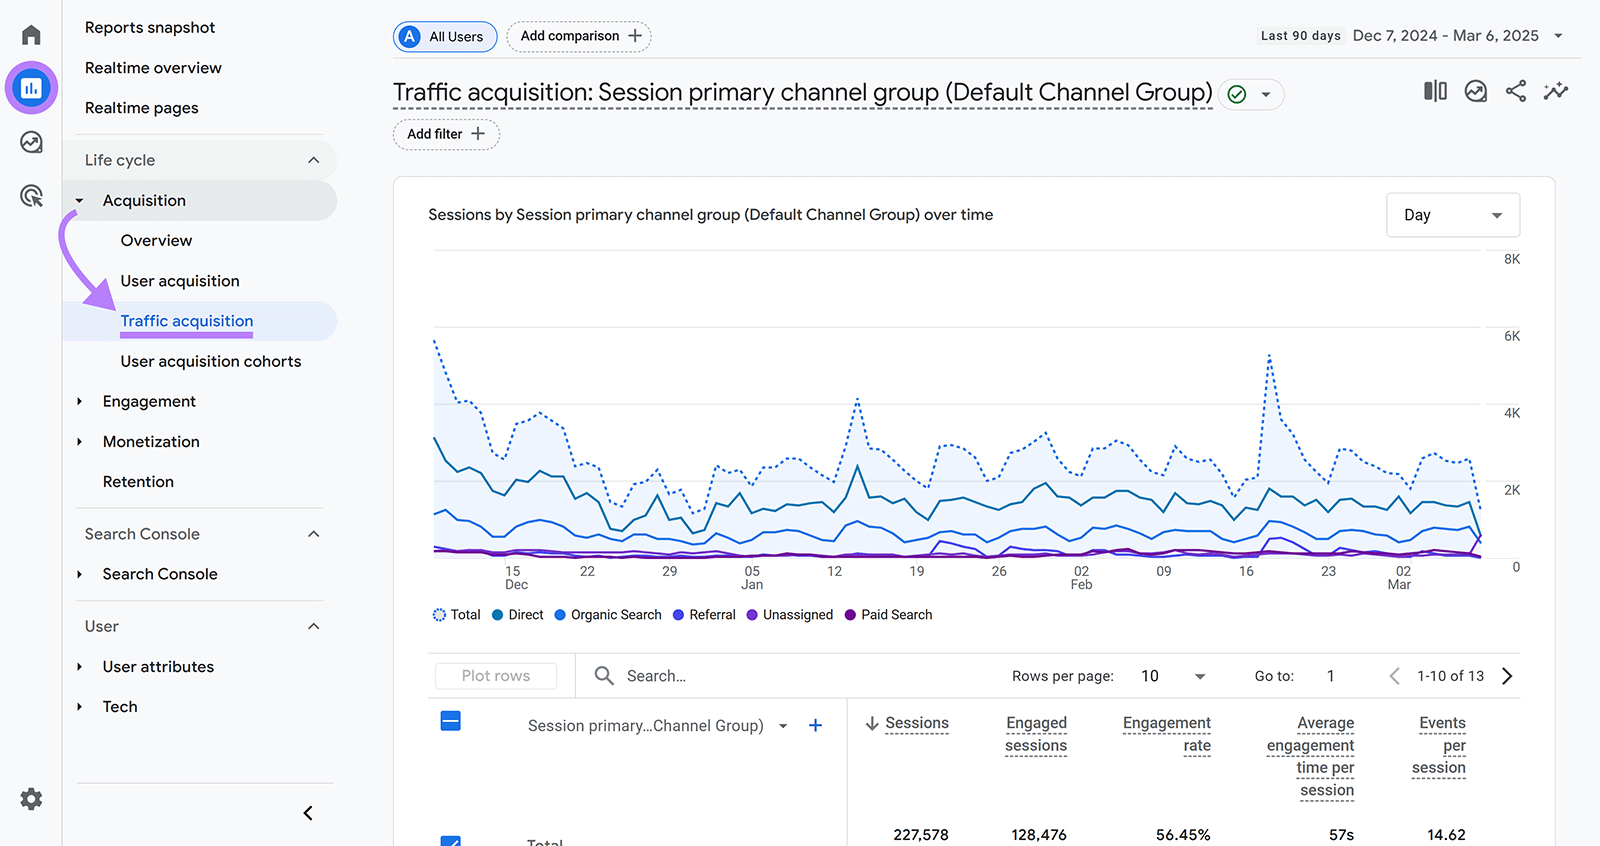
The traffic acquisition report in GA4 shows how sessions start, which channels drive the most traffic, and how visitors engage and convert.
To locate this report, go to “Reports” > “Acquisition” > “Traffic Acquisition.”
Events Report
The events report in GA4 shows interactions tracked as events (clicks, scrolls, purchases, etc.), so you can see how users engage with your site and identify areas to improve the user experience.
Access this report by going to “Reports” > “Engagement” > “Events.”
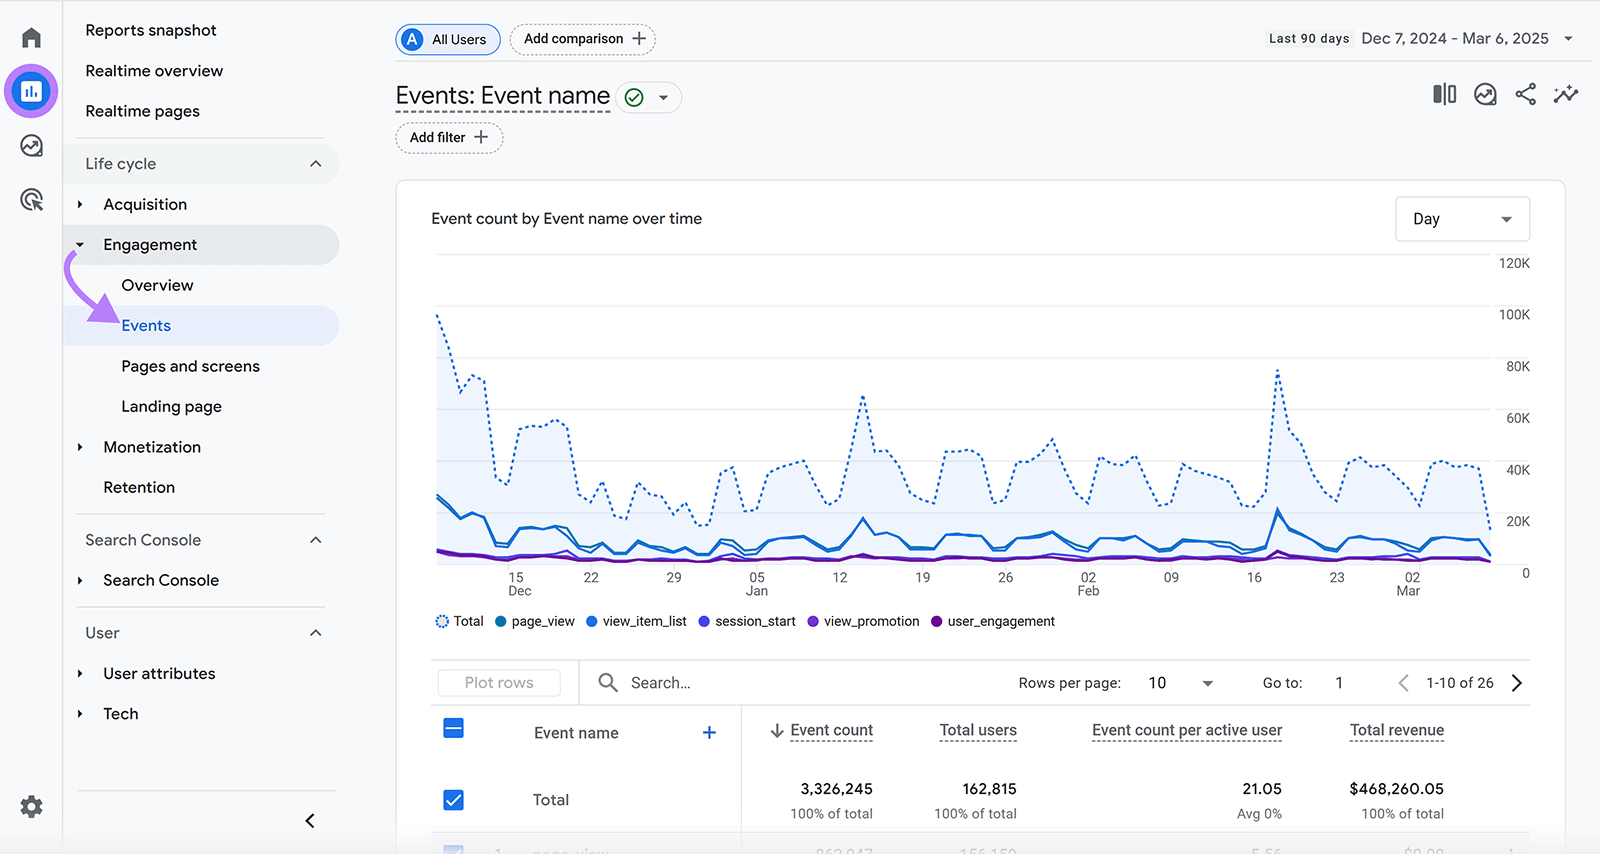
Click the “+” sign by “Event name” to add another dimension to your report (e.g., pages). This can help you analyze which pages visitors interact with most or least.
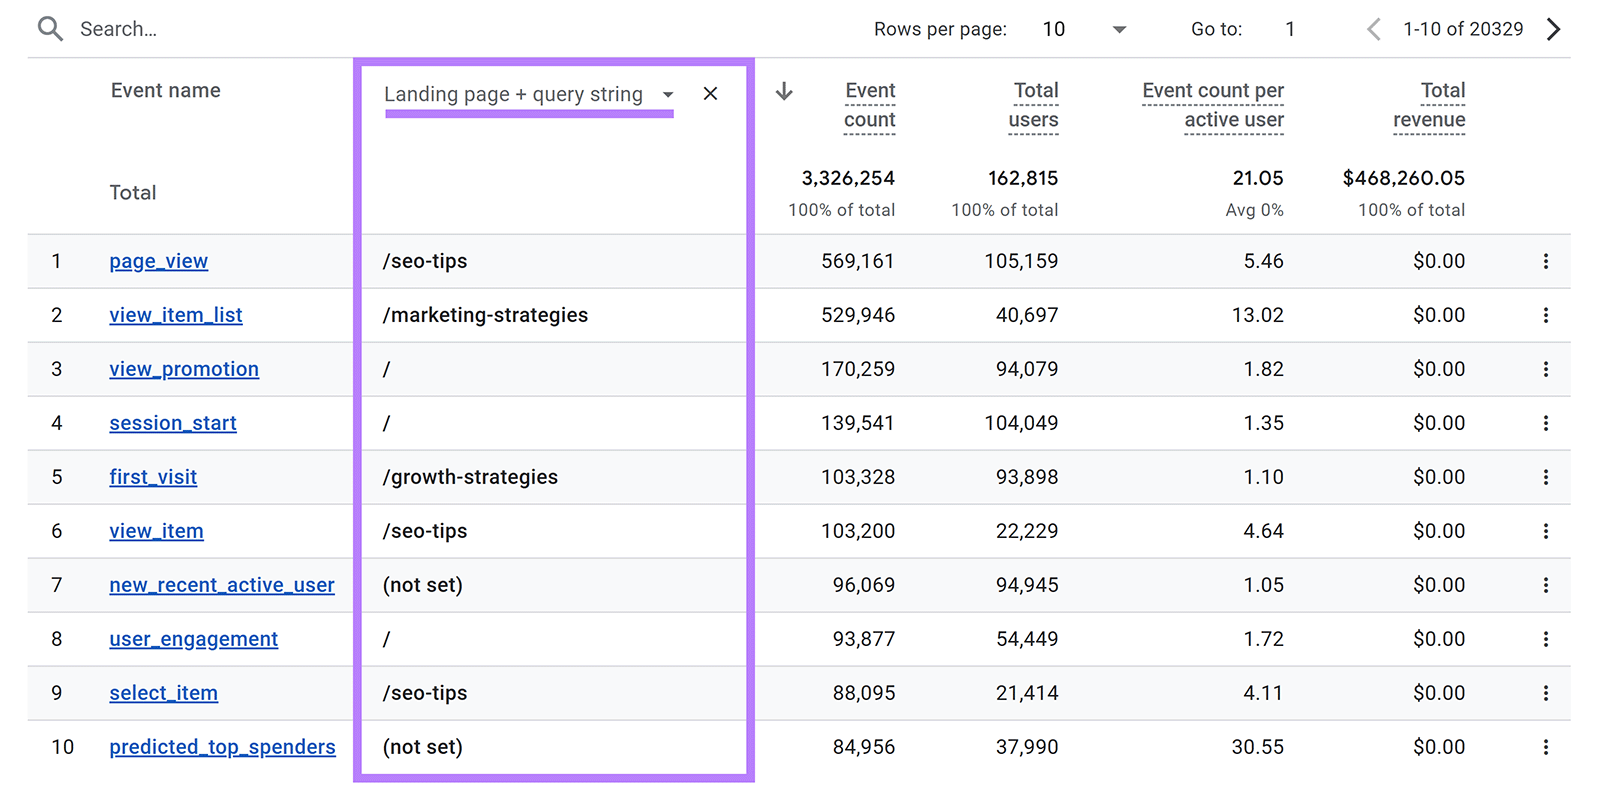
For example, if a landing page has a high number of scroll events but a low number of form submissions, this could indicate that users are seeing the content but aren’t motivated to take action. And you could consider optimizing the call to action (CTA).
Ecommerce Purchases Report
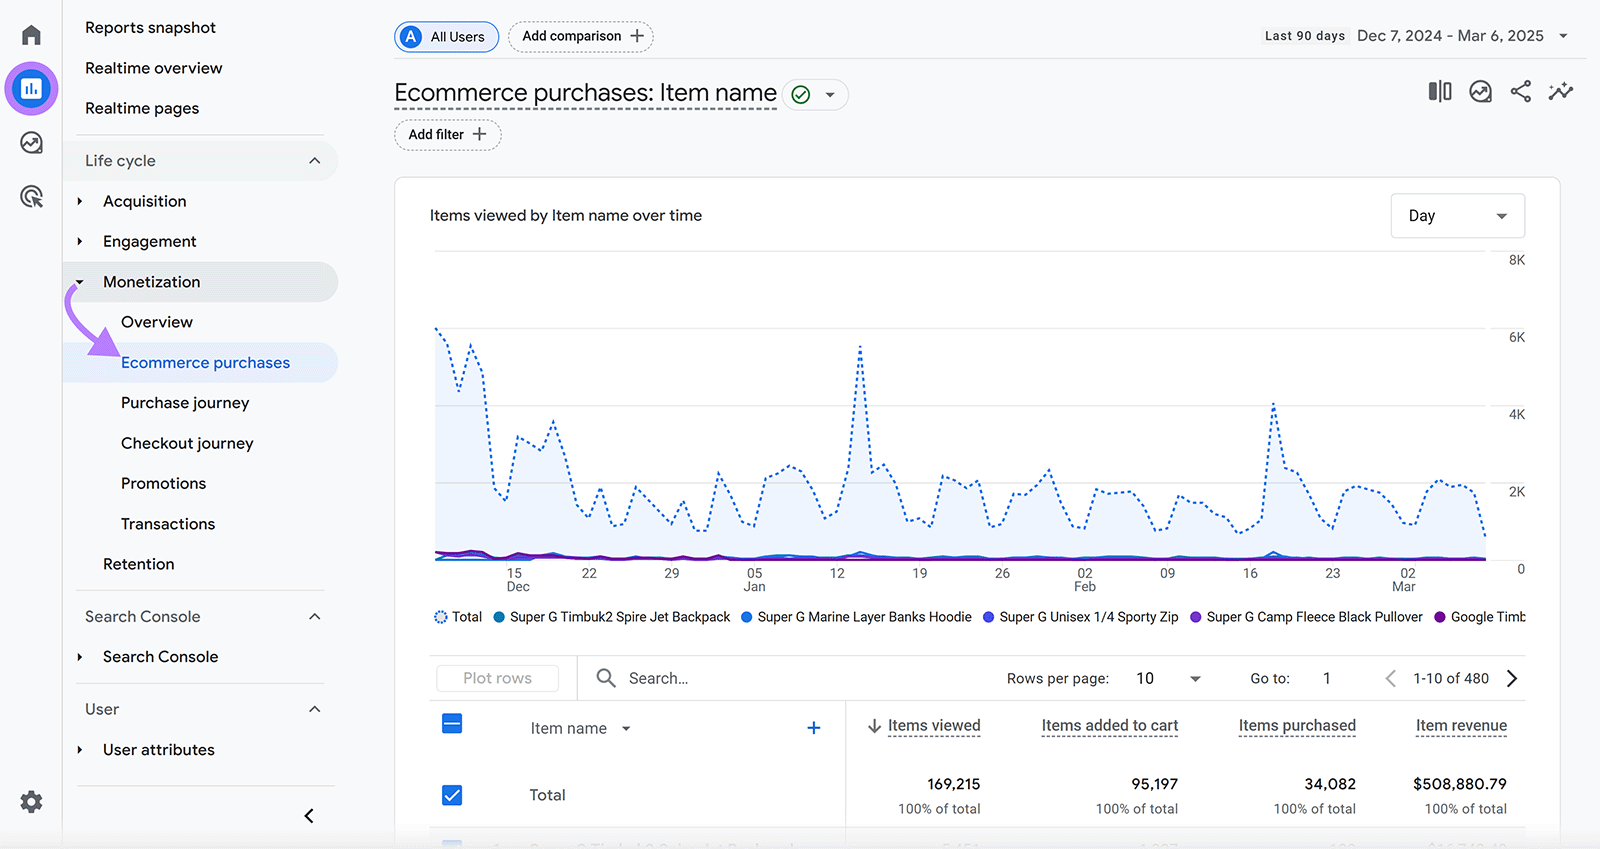
The ecommerce purchases report shows which products people buy, how often they buy them, and the revenue each product generates. These insights help you understand buyer behavior.
To see this report, go to “Reports” > “Monetization” > “Ecommerce purchases.”
Landing Page Report
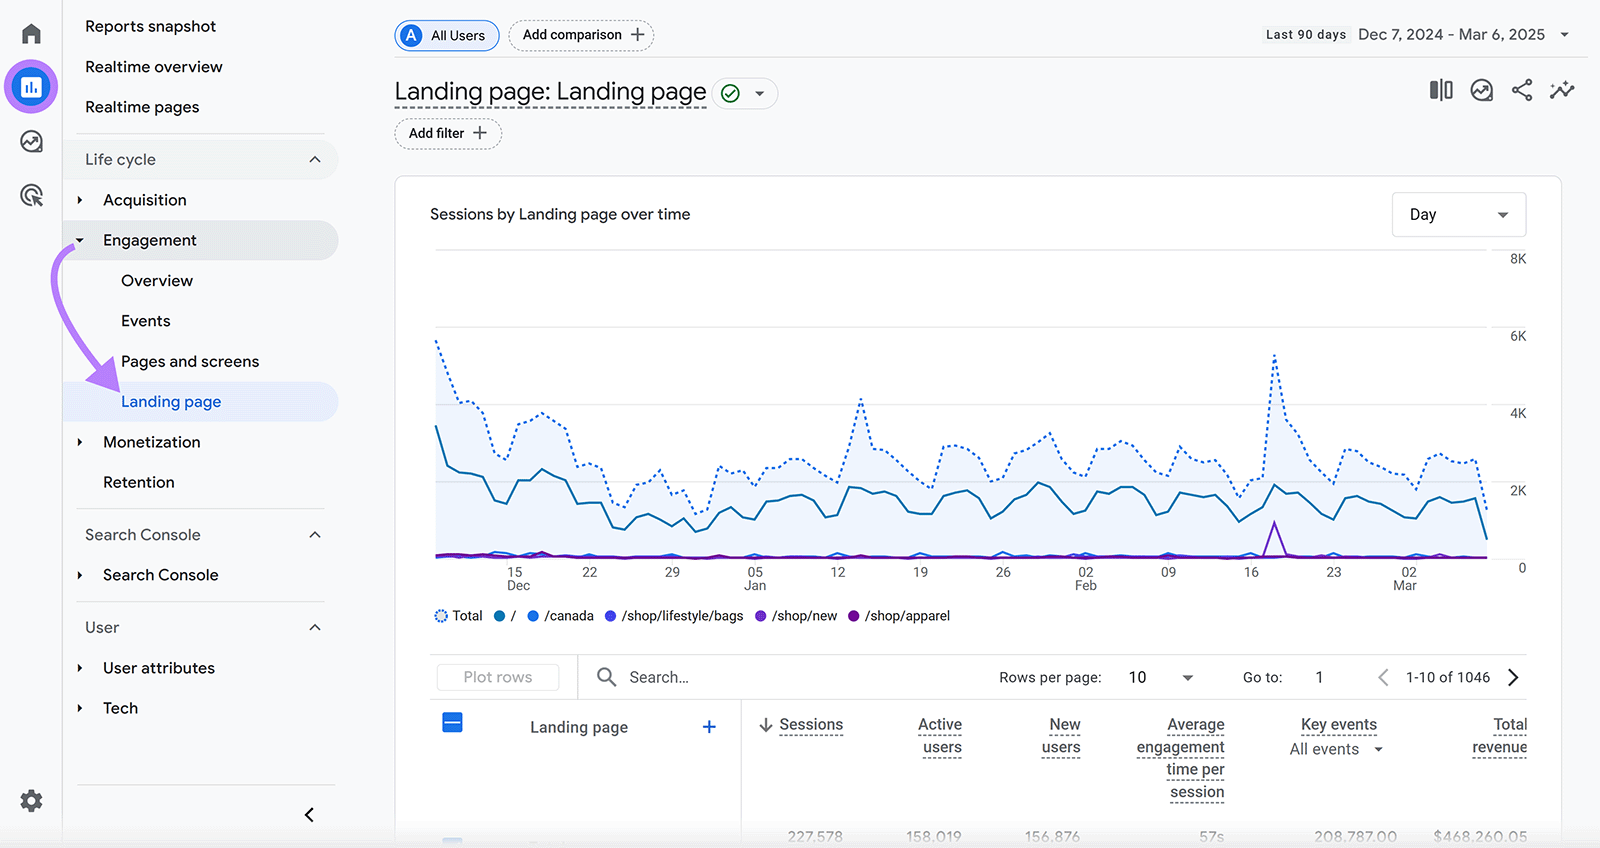
GA4’s landing page report breaks down traffic by landing page. It shows which pages attract users first and how those pages affect engagement and conversion.
Get the landing pages report by going to “Reports” > “Engagement” > “Landing page”
Easily Track Your Site’s Performance
Semrush’s Project Dashboard combines data from GA4, Google Search Console, and Semrush to provide an overview of key metrics for your site and without requiring a custom analytics dashboard in Google.
When you click any “View full report” button, you go directly to the selected report. Which allows you to explore specific areas in greater detail.
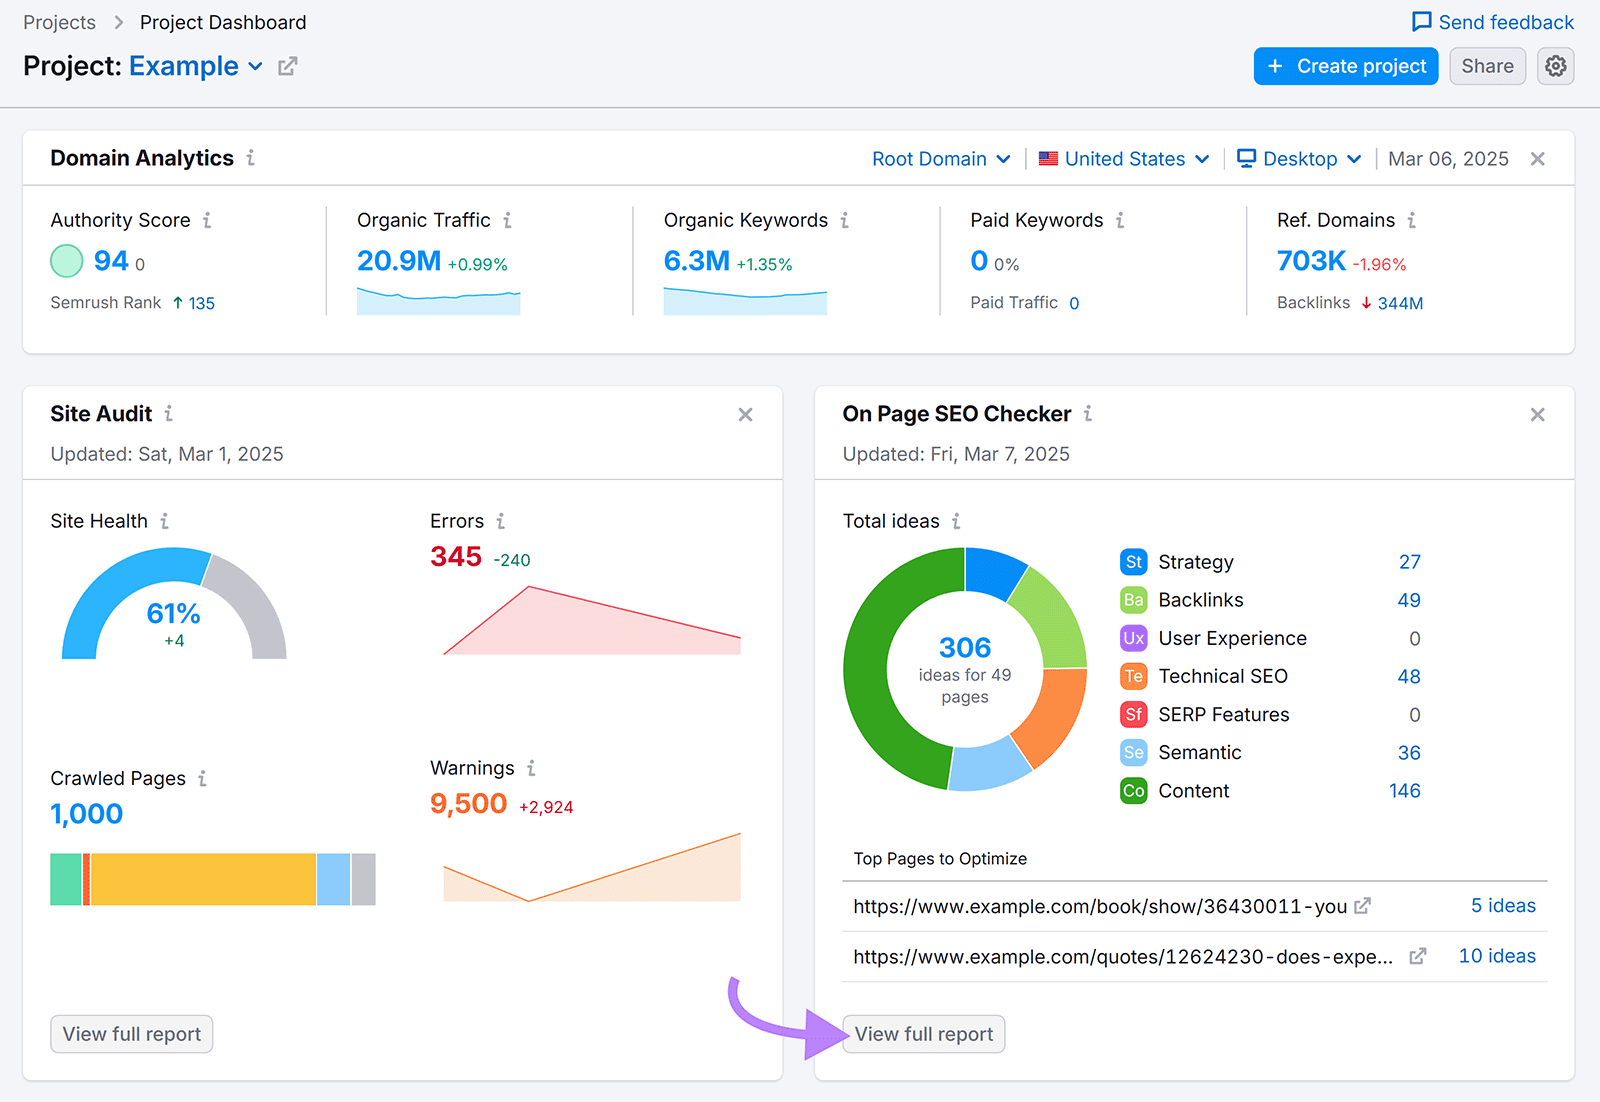
Want a simple dashboard to review key metrics? Set up Project Dashboard when you sign up for an account.
Source link
